Input data and parameters
QualiMap command line
| qualimap bamqc -bam /share/biocore/projects/Internal_Jessie_UCD/Workshops/Epigenetics/03-Bismark/SRR9833662.1.inputSRR9833662.1_R1_001_bismark_bt2_pe.dedup.sorted.bam -c -nw 400 -hm 3 |
Alignment
| Command line: | "bismark --bowtie2 -p 4 --output_dir ./ --rg_tag --rg_id SRR9833662.1 --rg_sample SRR9833662.1 --prefix SRR9833662.1 --unmapped --temp_dir /share/biocore/projects/Internal_Jessie_UCD/Workshops/Epigenetics/scripts/tmp --phred33-quals --fastq --genome_folder /share/biocore/projects/Internal_Jessie_UCD/Workshops/Epigenetics/References -1 inputSRR9833662.1_R1_001.fq -2 inputSRR9833662.1_R2_001.fq" |
| Draw chromosome limits: | yes |
| Analyze overlapping paired-end reads: | no |
| Program: | Bismark (v0.22.3) |
| Analysis date: | Wed Nov 18 19:42:58 PST 2020 |
| Size of a homopolymer: | 3 |
| Skip duplicate alignments: | no |
| Number of windows: | 400 |
| BAM file: | /share/biocore/projects/Internal_Jessie_UCD/Workshops/Epigenetics/03-Bismark/SRR9833662.1.inputSRR9833662.1_R1_001_bismark_bt2_pe.dedup.sorted.bam |
Summary
Globals
| Reference size | 2,730,871,774 |
| Number of reads | 262,985,030 |
| Mapped reads | 262,985,030 / 100% |
| Unmapped reads | 0 / 0% |
| Mapped paired reads | 262,985,030 / 100% |
| Mapped reads, first in pair | 131,492,515 / 50% |
| Mapped reads, second in pair | 131,492,515 / 50% |
| Mapped reads, both in pair | 262,985,030 / 100% |
| Mapped reads, singletons | 0 / 0% |
| Read min/max/mean length | 20 / 106 / 93.98 |
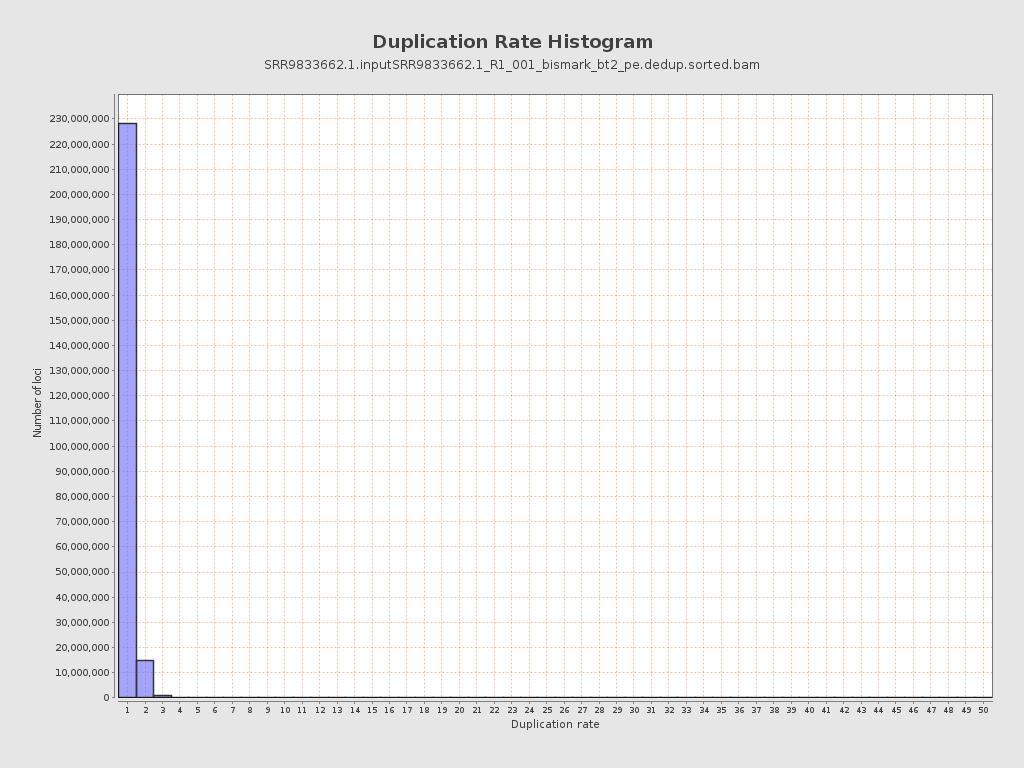
| Duplicated reads (estimated) | 18,882,540 / 7.18% |
| Duplication rate | 6.54% |
| Clipped reads | 0 / 0% |
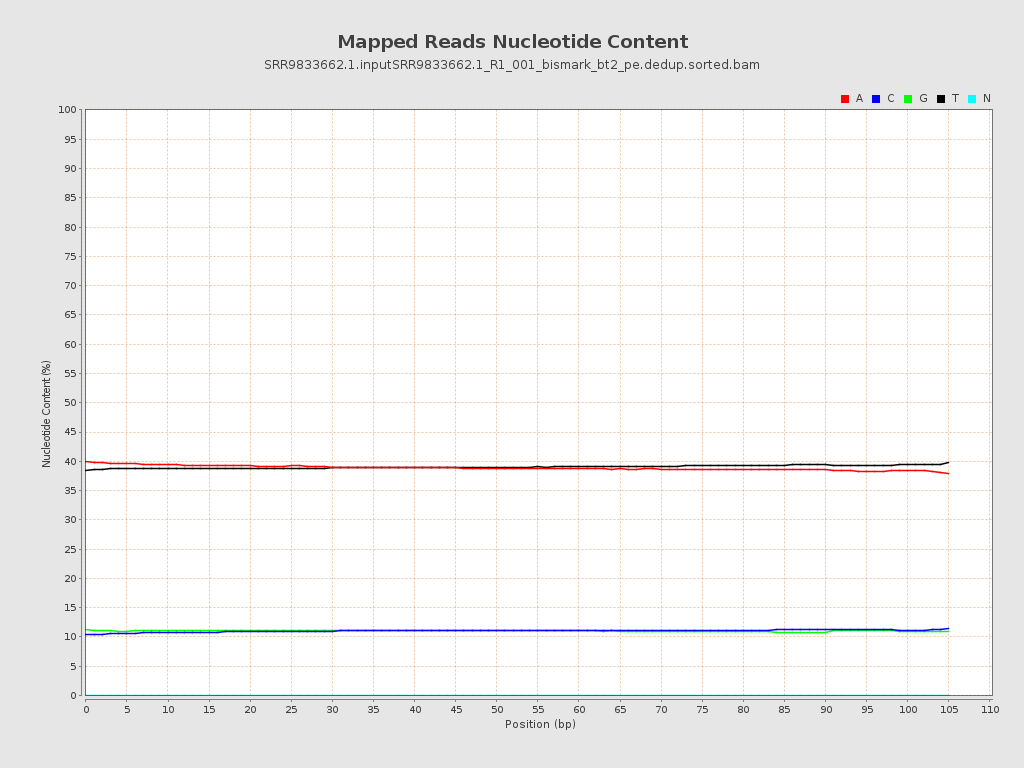
ACGT Content
| Number/percentage of A's | 9,620,000,070 / 38.93% |
| Number/percentage of C's | 2,725,457,969 / 11.03% |
| Number/percentage of T's | 9,639,039,348 / 39% |
| Number/percentage of G's | 2,728,988,502 / 11.04% |
| Number/percentage of N's | 381,539 / 0% |
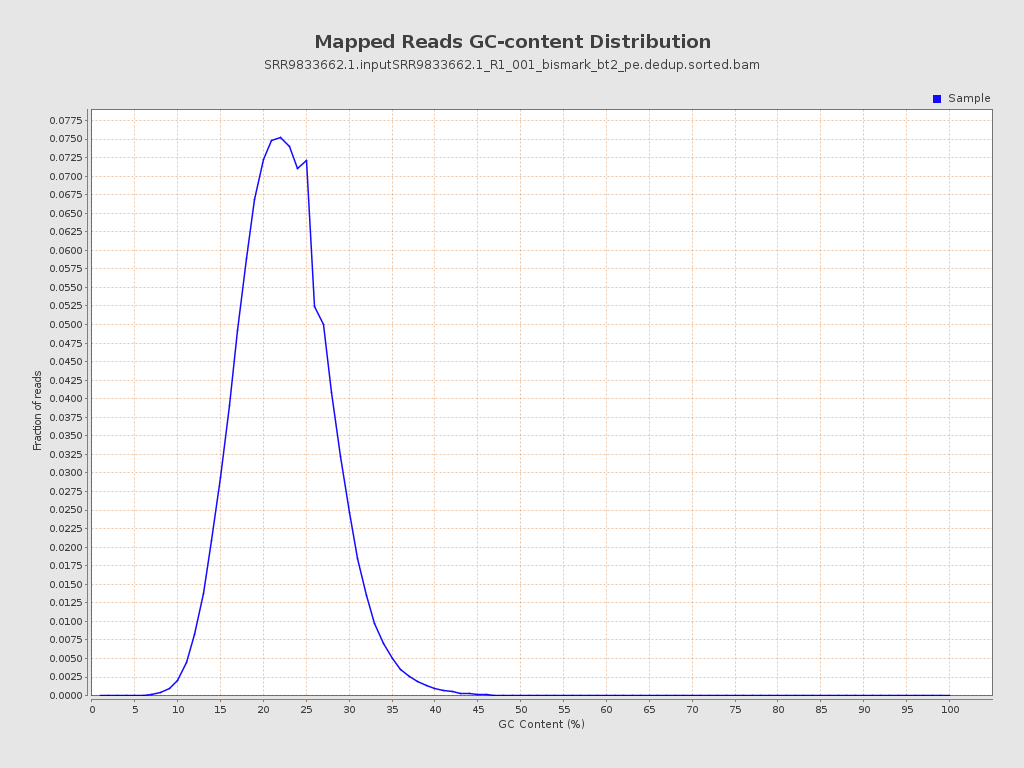
| GC Percentage | 22.07% |
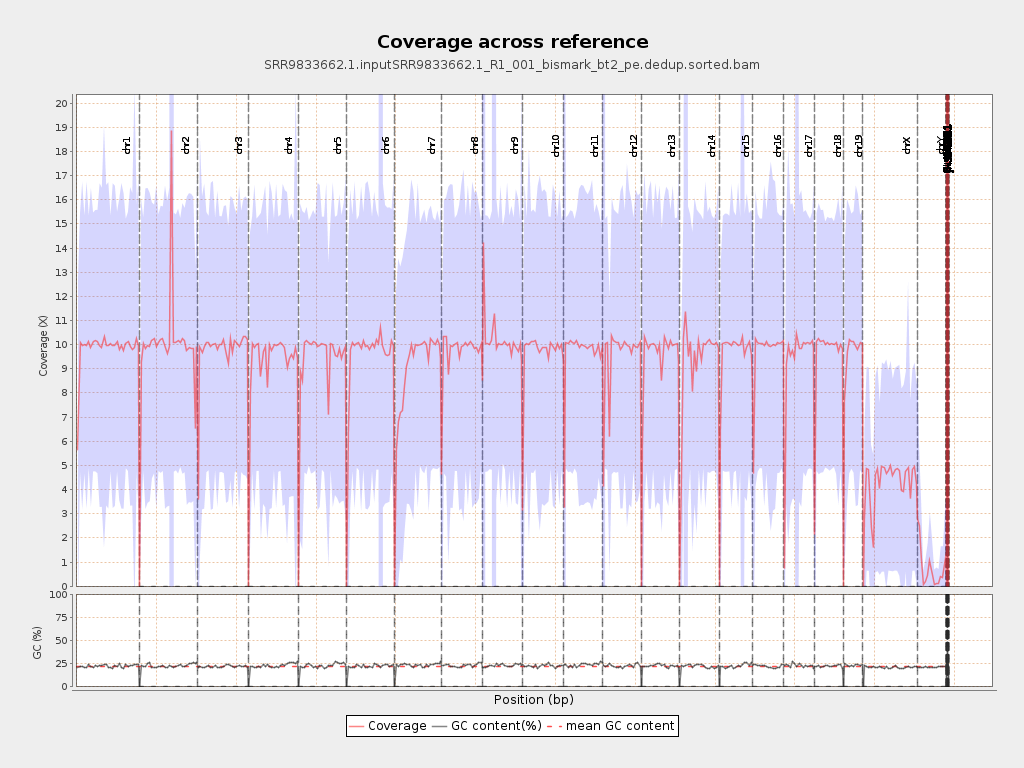
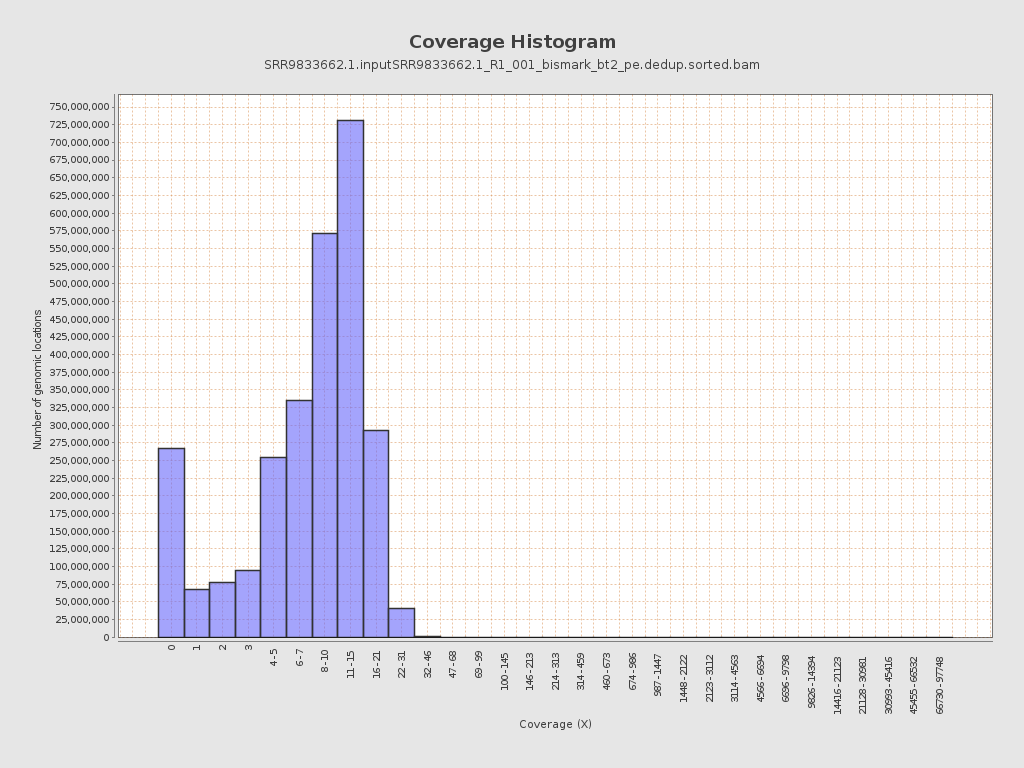
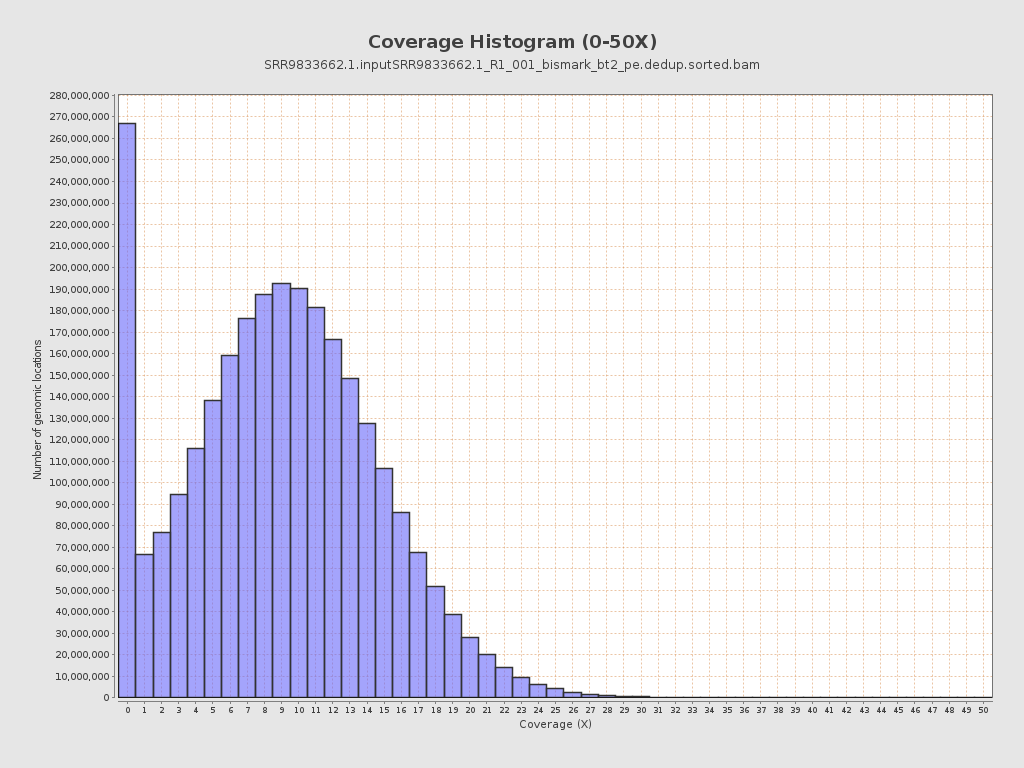
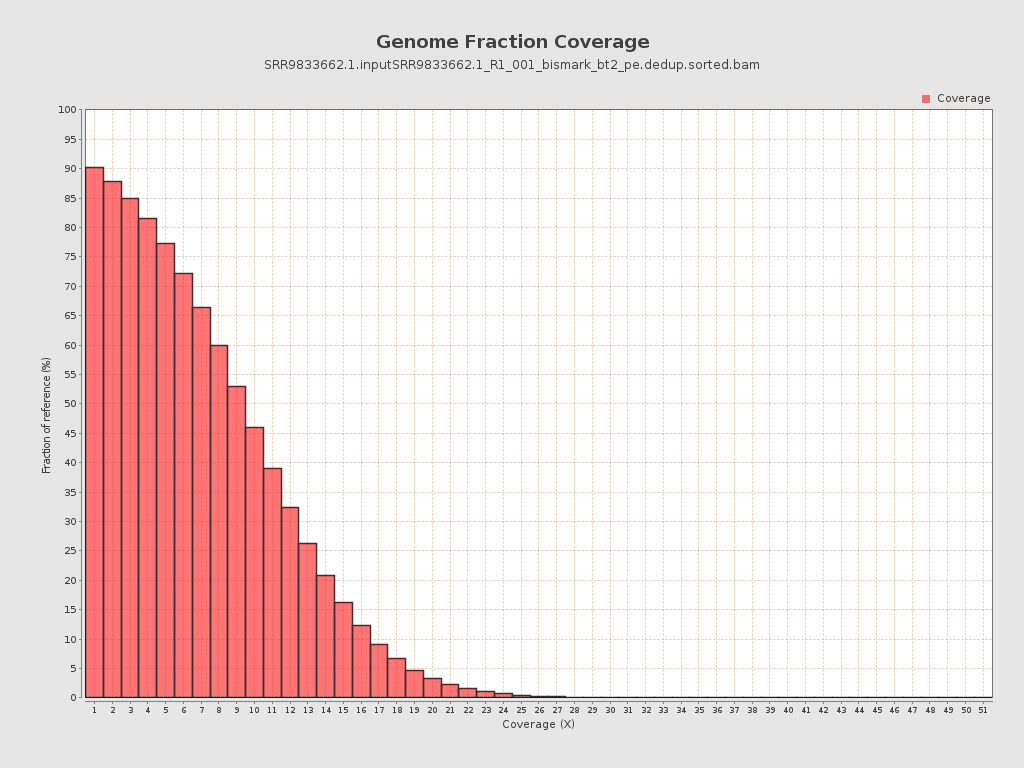
Coverage
| Mean | 9.0506 |
| Standard Deviation | 39.8298 |
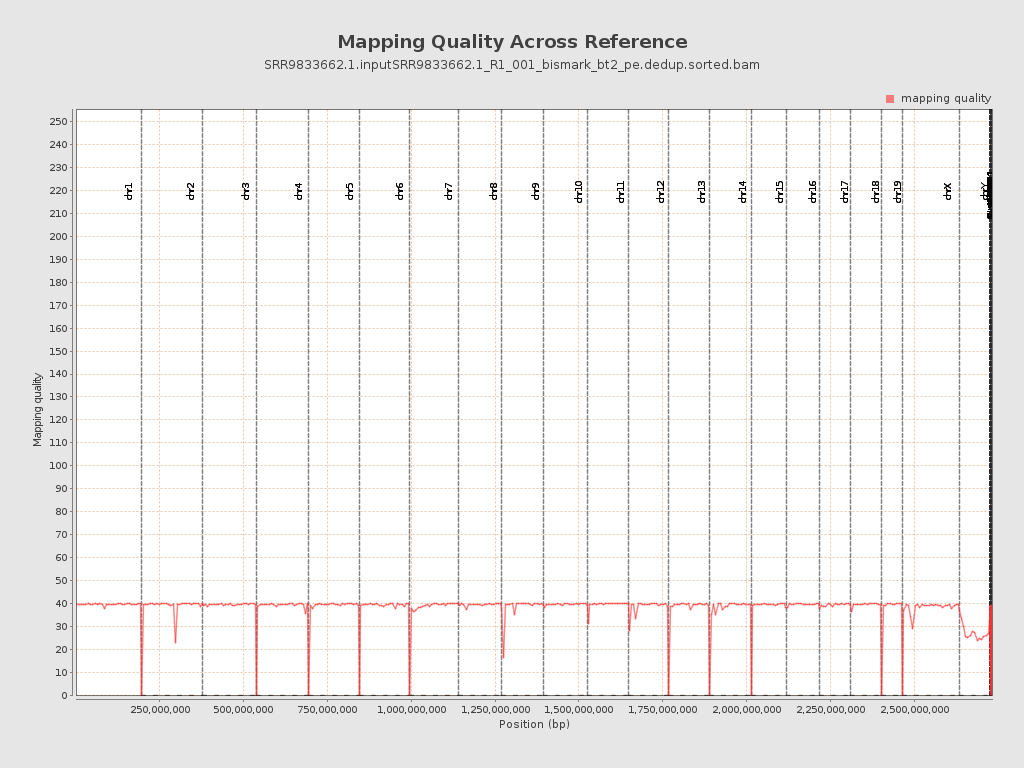
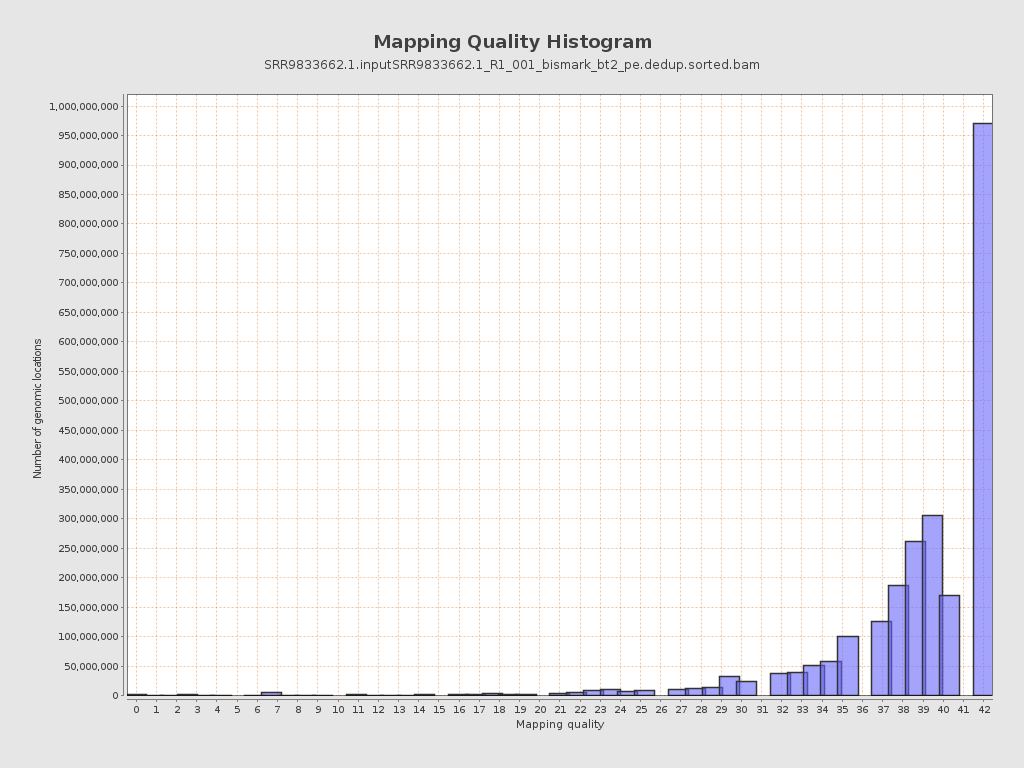
Mapping Quality
| Mean Mapping Quality | 36.87 |
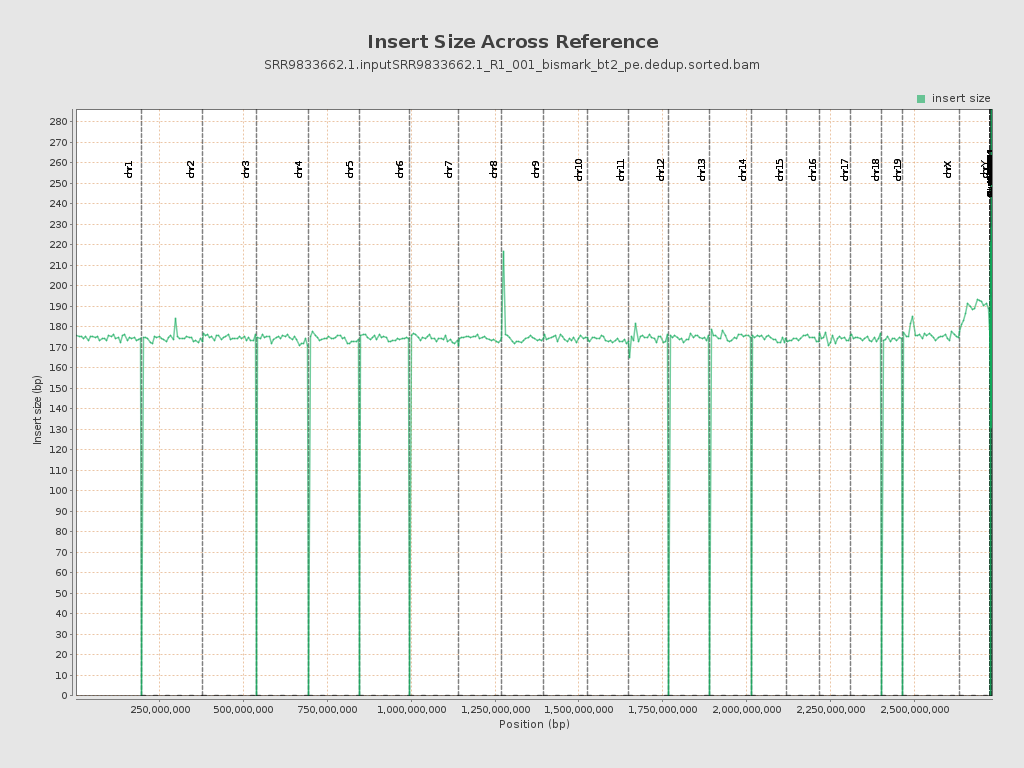
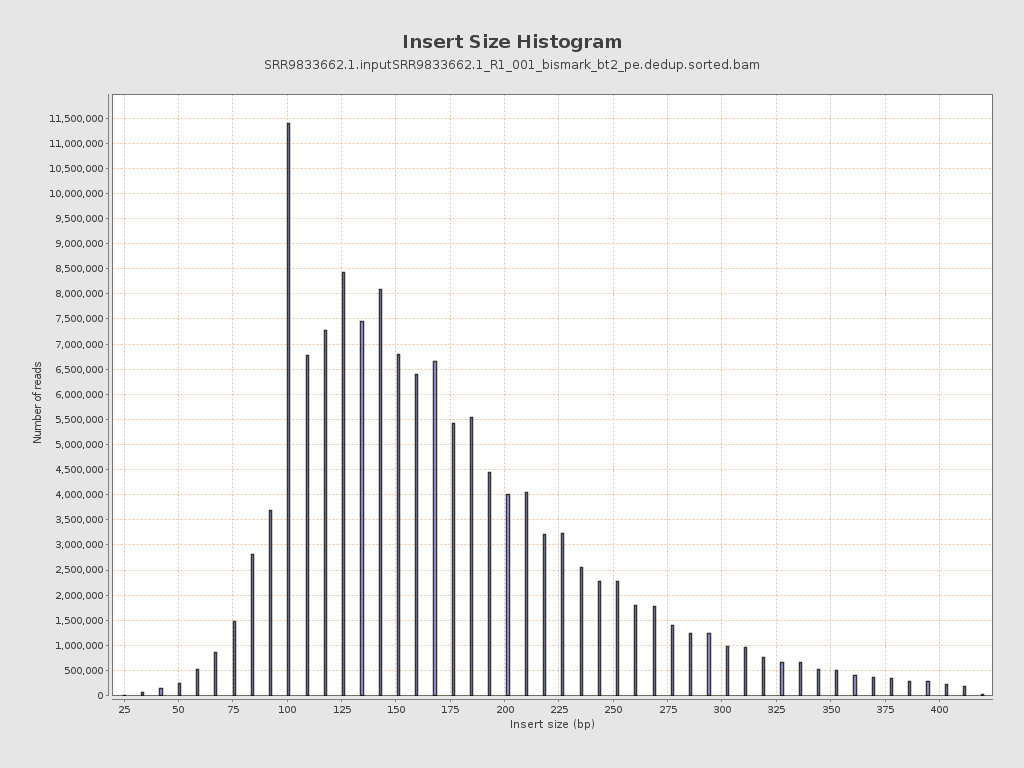
Insert size
| Mean | 175.04 |
| Standard Deviation | 70.52 |
| P25/Median/P75 | 123 / 159 / 210 |
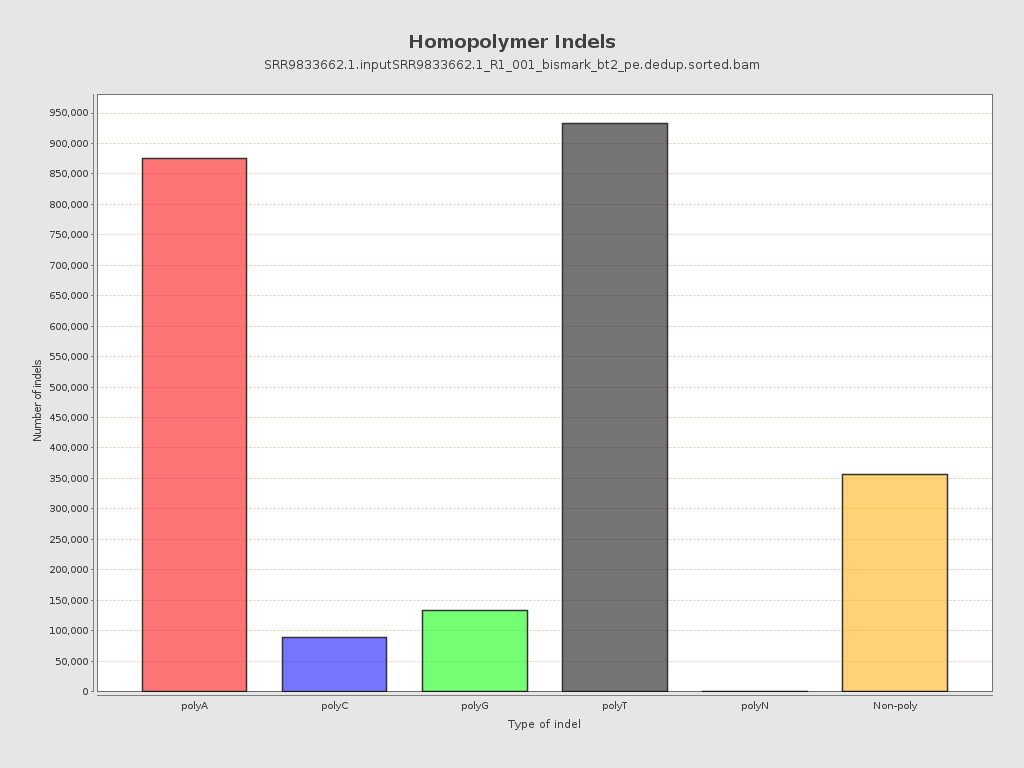
Mismatches and indels
| General error rate | 19.43% |
| Mismatches | 4,801,142,664 |
| Insertions | 481,089 |
| Mapped reads with at least one insertion | 0.18% |
| Deletions | 1,906,664 |
| Mapped reads with at least one deletion | 0.72% |
| Homopolymer indels | 85.06% |
Chromosome stats
| Name | Length | Mapped bases | Mean coverage | Standard deviation |
| chr1 | 195471971 | 1927494842 | 9.8607 | 5.6318 |
| chr2 | 182113224 | 1830148939 | 10.0495 | 130.7337 |
| chr3 | 160039680 | 1567709738 | 9.7958 | 5.4883 |
| chr4 | 156508116 | 1488731142 | 9.5122 | 5.7743 |
| chr5 | 151834684 | 1447881326 | 9.5359 | 5.4399 |
| chr6 | 149736546 | 1463422412 | 9.7733 | 27.6104 |
| chr7 | 145441459 | 1330805246 | 9.1501 | 5.5839 |
| chr8 | 129401213 | 1250871500 | 9.6666 | 5.4525 |
| chr9 | 124595110 | 1277290001 | 10.2515 | 77.3706 |
| chr10 | 130694993 | 1265738283 | 9.6847 | 5.5618 |
| chr11 | 122082543 | 1189070303 | 9.7399 | 7.3297 |
| chr12 | 120129022 | 1151467352 | 9.5853 | 35.9109 |
| chr13 | 120421639 | 1164219704 | 9.6679 | 5.7376 |
| chr14 | 124902244 | 1169945878 | 9.3669 | 25.8351 |
| chr15 | 104043685 | 1007777900 | 9.6861 | 8.3601 |
| chr16 | 98207768 | 955911726 | 9.7336 | 5.5639 |
| chr17 | 94987271 | 909740404 | 9.5775 | 8.4285 |
| chr18 | 90702639 | 880859058 | 9.7115 | 5.4332 |
| chr19 | 61431566 | 580703049 | 9.4528 | 5.4485 |
| chrX | 171031299 | 735746447 | 4.3018 | 3.7049 |
| chrY | 91744698 | 60235048 | 0.6566 | 1.8929 |
| chrM | 16299 | 1467424 | 90.0315 | 57.8631 |
| GL456210.1 | 169725 | 1341360 | 7.9031 | 8.5823 |
| GL456211.1 | 241735 | 2079438 | 8.6021 | 12.0924 |
| GL456212.1 | 153618 | 1546228 | 10.0654 | 14.0804 |
| GL456213.1 | 39340 | 0 | 0 | 0 |
| GL456216.1 | 66673 | 489763 | 7.3457 | 5.38 |
| GL456219.1 | 175968 | 2726 | 0.0155 | 0.2415 |
| GL456221.1 | 206961 | 1426030 | 6.8903 | 10.9936 |
| GL456233.1 | 336933 | 1496247 | 4.4408 | 3.2745 |
| GL456239.1 | 40056 | 1554964 | 38.8198 | 19.8851 |
| GL456350.1 | 227966 | 10081 | 0.0442 | 1.5052 |
| GL456354.1 | 195993 | 157403 | 0.8031 | 2.0796 |
| GL456359.1 | 22974 | 266370 | 11.5944 | 5.9526 |
| GL456360.1 | 31704 | 292918 | 9.2391 | 5.4474 |
| GL456366.1 | 47073 | 379509 | 8.0621 | 5.7389 |
| GL456367.1 | 42057 | 172081 | 4.0916 | 3.2142 |
| GL456368.1 | 20208 | 210285 | 10.406 | 9.655 |
| GL456370.1 | 26764 | 187178 | 6.9936 | 7.3393 |
| GL456372.1 | 28664 | 228251 | 7.963 | 8.9066 |
| GL456378.1 | 31602 | 443941 | 14.0479 | 15.6974 |
| GL456379.1 | 72385 | 317957 | 4.3926 | 3.3014 |
| GL456381.1 | 25871 | 124747 | 4.8219 | 4.035 |
| GL456382.1 | 23158 | 83452 | 3.6036 | 3.2875 |
| GL456383.1 | 38659 | 317821 | 8.2211 | 7.6057 |
| GL456385.1 | 35240 | 302675 | 8.589 | 5.0289 |
| GL456387.1 | 24685 | 363065 | 14.7079 | 11.5201 |
| GL456389.1 | 28772 | 231148 | 8.0338 | 51.2153 |
| GL456390.1 | 24668 | 67746 | 2.7463 | 3.7262 |
| GL456392.1 | 23629 | 1251246 | 52.9538 | 340.1822 |
| GL456393.1 | 55711 | 649909 | 11.6657 | 6.7851 |
| GL456394.1 | 24323 | 165346 | 6.7979 | 6.4043 |
| GL456396.1 | 21240 | 209101 | 9.8447 | 72.8063 |
| JH584292.1 | 14945 | 189667 | 12.691 | 7.8514 |
| JH584293.1 | 207968 | 183 | 0.0009 | 0.0297 |
| JH584294.1 | 191905 | 581 | 0.003 | 0.0575 |
| JH584295.1 | 1976 | 9233 | 4.6726 | 4.0626 |
| JH584296.1 | 199368 | 53938 | 0.2705 | 1.276 |
| JH584297.1 | 205776 | 72551 | 0.3526 | 1.3645 |
| JH584298.1 | 184189 | 919 | 0.005 | 0.095 |
| JH584299.1 | 953012 | 1357370 | 1.4243 | 3.1099 |
| JH584300.1 | 182347 | 2038 | 0.0112 | 0.1154 |
| JH584301.1 | 259875 | 1953 | 0.0075 | 0.1021 |
| JH584302.1 | 155838 | 591 | 0.0038 | 0.0699 |
| JH584303.1 | 158099 | 2470 | 0.0156 | 0.1533 |
| JH584304.1 | 114452 | 40757625 | 356.1111 | 464.6503 |