Sequence preprocessing
Why preprocess reads
We have found that aggressively “cleaning” and processing reads can make a large difference to the speed and quality of mapping and assembly results. Cleaning your reads means, removing reads/bases that are:
- Other unwanted sequence (Ex. polyA tails in RNAseq data)
- Artificially added onto sequence of primary interest (vectors, adapters, primers)
- join short overlapping paired-end reads
- low quality bases
- originate from PCR duplication
- not of primary interest (contamination)
Preprocessing also produces a number of statistics that are technical in nature that should be used to evaluate “experimental consistency”.
Many read preprocessing strategies over time
- Identity and remove contaminant and vector reads
- Reads which appear to fully come from extraneous sequence should be removed.
- Quality trim/cut
- “End” trim a read until the average quality > Q (Lucy)
- Remove any read with average quality < Q
- Eliminate singletons/duplicates
- If you have excess depth of coverage, and particularly if you have at least x-fold coverage where x is the read length, then eliminating singletons is a nice way of dramatically reducing the number of error-prone reads.
- Read which appear the same (particularly paired-end) are often more likely PCR duplicates and therefor redundant reads.
- Eliminate all reads (pairs) containing an “N” character
- If you can afford the loss of coverage, you might throw away all reads containing Ns.
- Identity and trim off adapter and barcodes if present
- Believe it or not, the software provided by Illumina, either does not look for, or does a mediocre job of, identifying adapters and removing them.
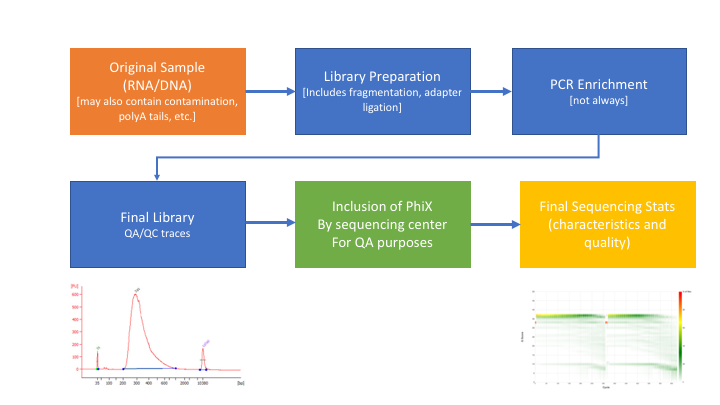
** Many technical things happen between original sample and data, preprocessing is working backwards through that process to get as close as we can to original sample **
- Remove contaminants (at least PhiX).
- Remove PCR duplicates.
- Join and potentially extend, overlapping paired end reads
- If reads completely overlap they will contain adapter, remove adapters
- Identify and remove any adapter dimers present
- Trim sequences (5’ and 3’) by quality score (I like Q20)
- Cleanup
- Remove any reads that are less then the minimum length parameter
- Run a polyA/T trimmer (optional)
- Produce preprocessing statistics
HTStream - preprocessing application
Can be downloaded from here. Fast C++ implementation, designed to have discreet applications that can be pipelined together using unix piping. We hope in the long run to include any and all needed preprocessing routines. Includes:
- hts_AdapterTrimmer - identify and remove adapter sequences
- hts_NTrimmer - extrat the longest subsequence with no Ns
- hts_PolyATTrim - identify and remove polyA/T sequence (least robust algorithm)
- hts_SeqScreener - identify and remove/keep/count contaminants (default phiX)
- hts_SuperDeduper - identify and remove PCR duplicates
- hts_CutTrim - discreet 5’ and/or 3’ basepair trimming
- hts_Overlapper - Overlap paired end reads (cutting off adapters when present)
- hts_QWindowTrim - 5’ and/or 3’ prime quality score trimming using windows
- hts_Stats - compute read stats
Data Setup
Let’s set up a project directory for the week, and talk a bit about project philosophy..
1. First, create a directory for your user and the example project in the workshop directory:
cd
mkdir -p /share/workshop/$USER/variant_example
2a. Next, go into that directory, create a raw data directory (we are going to all this 00-RawData) and cd into that directory. Lets then create a symbolic link to a directory that contains the raw data.
cd /share/workshop/$USER/variant_example
mkdir 00-RawData
cd 00-RawData/
ln -s /share/biocore/workshops/Variant-Analysis-Workshop/00-RawData/* .
This directory now contains a folder for each sample and the original fastq files for each sample are in the sample folder.
2b. lets create a sample sheet for the project, store sample names in a file called samples.txt
ls > ../samples.txt
cat
3. Now, take a look at the raw data directory.
ls
4. You will see a list of directories and some other files. Take a look at all the files in all of the directories:
ls *
5. Pick a directory and go into it. View the contents of the files using the ‘less’ command, when gzipped used ‘zless’ (which is just the ‘less’ command for gzipped files):
cd A8100/
less A8100.chr18.R1.fastq
Make sure you can identify which lines correspond to a single read and which lines are the header, sequence, and quality values. Press ‘q’ to exit this screen. Then, let’s figure out the number of reads in this file. A simple way to do that is to count the number of lines and divide by 4 (because the record of each read uses 4 lines). In order to do this use cat to output the uncompressed file and pipe that to “wc” to count the number of lines:
cat A8100.chr18.R1.fastq | wc -l
Divide this number by 4 and you have the number of reads in this file. One more thing to try is to figure out the length of the reads without counting each nucleotide. First get the first 4 lines of the file (i.e. the first record):
cat A8100.chr18.R1.fastq | head -4
Note the header lines (1st and 3rd line) and sequence and quality lines (2nd and 4th) in each 4-line fastq block. Then, copy and paste the DNA sequence line into the following command (replace [sequence] with the line):
echo -n [sequence] | wc -c
This will give you the length of the read. See if you can figure out how this command works.
6. Now go back to your ‘variant_example’ directory and create another directory called ‘01-HTS_Preproc’:
cd /share/workshop/$USER/variant_example
mkdir 01-HTS_Preproc
The results of our preprocessing steps will be put into the 01-HTS_Preproc directory. The next step after that will go into a “02-…” directory, etc. You can collect scripts that perform each step, and notes and metadata relevant for each step, in the directory for that step. This way anyone looking to replicate your analysis has limited places to search for the commands you used. In addition, you may want to change the permissions on your original 00-RawData directory to “read only”, so that you can never corrupt your raw data. (We won’t worry about this here, because we’ve linked in sample folders).
Preprocessing our Raw data
1. Let’s run the first step of our HTStream preprocessing pipeline, which is always to gather basic stats on the read files. For now, we’re only going to run one sample through the pipeline.
1a. So let’s first take a small subsample of reads, just so our trial run through the pipeline goes really quickly.
cd /share/workshop/$USER/variant_example
mkdir HTS_testing
cd HTS_testing
cat ../00-RawData/A8100/A8100.chr18.R1.fastq | head -400000 | gzip > A8100.subset.chr18.R1.fastq.gz
cat ../00-RawData/A8100/A8100.chr18.R2.fastq | head -400000 | gzip > A8100.subset.chr18.R2.fastq.gz
ls
So we cat (uncompress and send to screen), pipe to head (param -400000) then pipe to gzip to compress and name our files subset.
How many reads are we going to analyze in our subset?
1b. Now we’ll run our first preprocessing step … hts_Stats, first loading the module and then looking at help.
cd /share/workshop/$USER/variant_example/HTS_testing
module load htstream/0.3.1
hts_Stats --help
msettles@cabernet: ~$hts_Stats -h
HTStream <https://github.com/ibest/HTStream> application: hts_Stats
Version: 0.3.1
The hts_Stats app produce basic statistics about the reads in a dataset.
  Including the basepair composition and number of bases Q30.

Standard Options:
  -v [ --version ]                      Version print
  -h [ --help ]                         Prints help documentation
  -N [ --notes ] arg                    Notes for the stats JSON
  -L [ --stats-file ] arg (=stats.log)  String for output stats file name
  -A [ --append-stats-file ]            Append to stats file

Input Options:
  -1 [ --read1-input ] arg              Read 1 paired end fastq input <space
                                        seperated for multiple files>
  -2 [ --read2-input ] arg              Read 2 paired end fastq input <space
                                        seperated for multiple files>
  -U [ --singleend-input ] arg          Single end read fastq input <space
                                        seperated for multiple files>
  -T [ --tab-input ] arg                Tab input <space seperated for multiple
                                        files>
  -I [ --interleaved-input ] arg        Interleaved fastq input <space
                                        seperated for multiple files>
  -S [ --from-stdin ]                   STDIN input <MUST BE TAB DELIMITED
                                        INPUT>

Output Options:
  -F [ --force ]                        Forces overwrite of files
  -p [ --prefix ] arg (=hts_Stats)      Prefix for output files
  -g [ --gzip-output ]                  Output gzipped files
  -f [ --fastq-output ]                 Output to Fastq format <PE AND/OR SE
                                        files>
  -t [ --tab-output ]                   Output to tab-delimited file format
  -i [ --interleaved-output ]           Output to interleaved fastq file <PE
                                        ONLY>
  -u [ --unmapped-output ]              Output to unmapped sam file format
  -O [ --to-stdout ]                    Output to STDOUT in tab-delimited file
                                        format


Please report any issues, request for enhancement, or comments to <https://github.com/ibest/HTStream/issues>
So now lets run hts_Stats and look at the output.
hts_Stats -1 A8100.subset.chr18.R1.fastq.gz \
          -2 A8100.subset.chr18.R2.fastq.gz \
          -L A8100.stats.log -f -g -p A8100.stats
What parameters did we use, what do they do?
Lets take a look at the output of stats
ls -lah
msettles@tadpole:/share/workshop/msettles/variant_example/HTS_testing$     ls -lah
total 33M
drwxrwsr-x 2 msettles workshop    7 Aug 28 22:14 .
drwxrwsr-x 5 msettles workshop    6 Aug 28 22:14 ..
-rw-rw-r-- 1 msettles workshop  658 Aug 28 22:14 A8100.stats.log
-rw-rw-r-- 1 msettles workshop 8.2M Aug 28 22:14 A8100.stats_R1.fastq.gz
-rw-rw-r-- 1 msettles workshop 8.2M Aug 28 22:14 A8100.stats_R2.fastq.gz
-rw-rw-r-- 1 msettles workshop 8.2M Aug 28 22:14 A8100.subset.chr18.R1.fastq.gz
-rw-rw-r-- 1 msettles workshop 8.2M Aug 28 22:14 A8100.subset.chr18.R2.fastq.gz
Which files were generated from hts_Stats?
Lets look at the file A8100.stats.log
The logs generated by htstream are in json format, like a database format but meant to be readable.
{ "hts_Stats_37162": {
    "Notes": "",
    "totalFragmentsInput": 100000,
    "totalFragmentsOutput": 100000,
    "R1_readlength_histogram": [ [101,100000] ],
    "R2_readlength_histogram": [ [101,100000] ],
    "Base_composition": {
        "A": 6194951,
        "C": 3901774,
        "G": 3895743,
        "T": 6198781,
        "N": 8751
    },
    "Single_end": {
        "SE_in": 0,
        "SE_out": 0,
        "SE_bpLen": 0,
        "SE_bQ30": 0
    },
    "Paired_end": {
        "PE_in": 100000,
        "PE_out": 100000,
        "R1_bpLen": 10100000,
        "R1_bQ30": 9441209,
        "R2_bpLen": 10100000,
        "R2_bQ30": 9062013
    }
  }
}
2. Next we are going to screen from ribosomal RNA (rRNA). IF for some reason you wanted to do that with DNA EXAMPLE OF SCREEN ONLY
Ribosomal RNA makes up 90% or more of a typical total RNA sample. Most library prep methods attempt to reduce the rRNA representation in a sample, oligoDt binds to polyA tails to enrich a sample for mRNA, where Ribo-depletion binds rRNA sequences to deplete the sample of rRNA. Neither technique is 100% efficient and so knowing the relative proportion of rRNA in each sample can be helpful.
Can screen for rRNA in our sample to determine rRNA content.
2a. Before we do so we need to find sequences of ribosomal RNA to screen against.
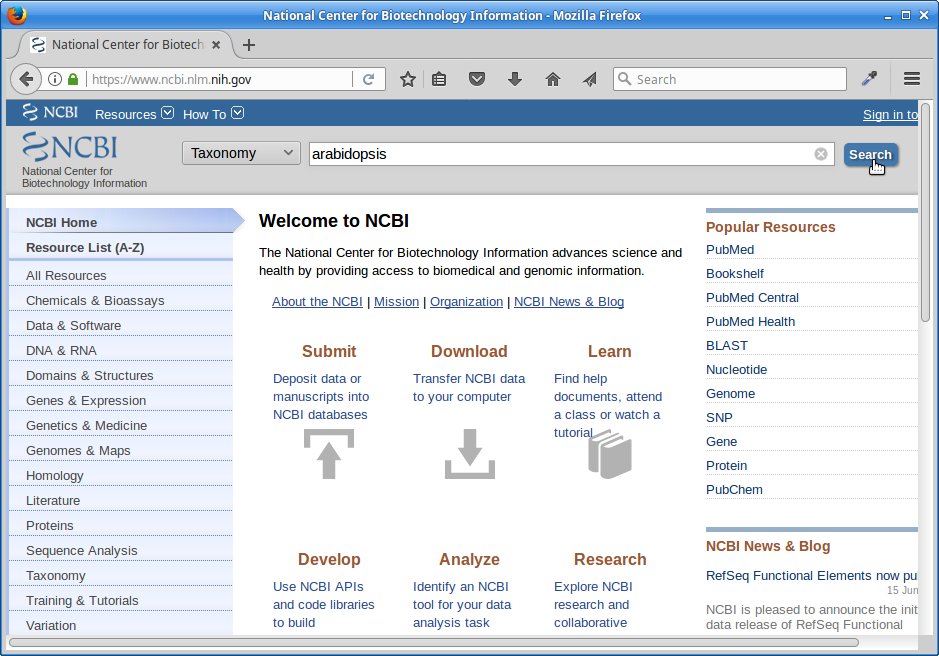
We will use these sequences to identify rRNA in our reads, which are from Arabidopsis thaliana. One way to do that is to go to NCBI and search for them.
1.) First, go to NCBI and in the Search dropdown select “Taxonomy” and search for “arabidopsis”.
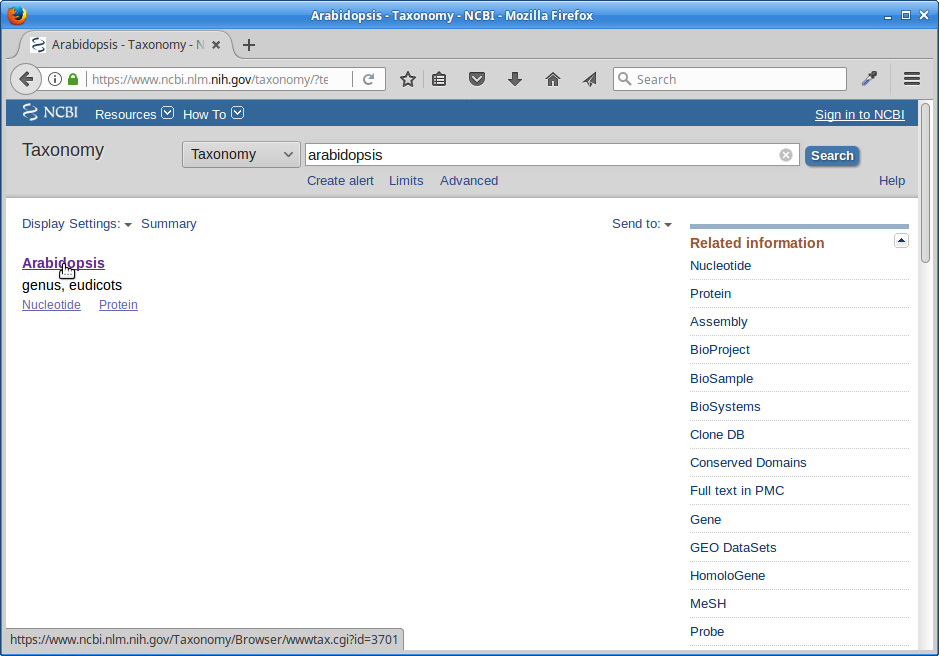
2.) Click on “Arabidopsis”.
3.) Click on “Arabidopsis” again.
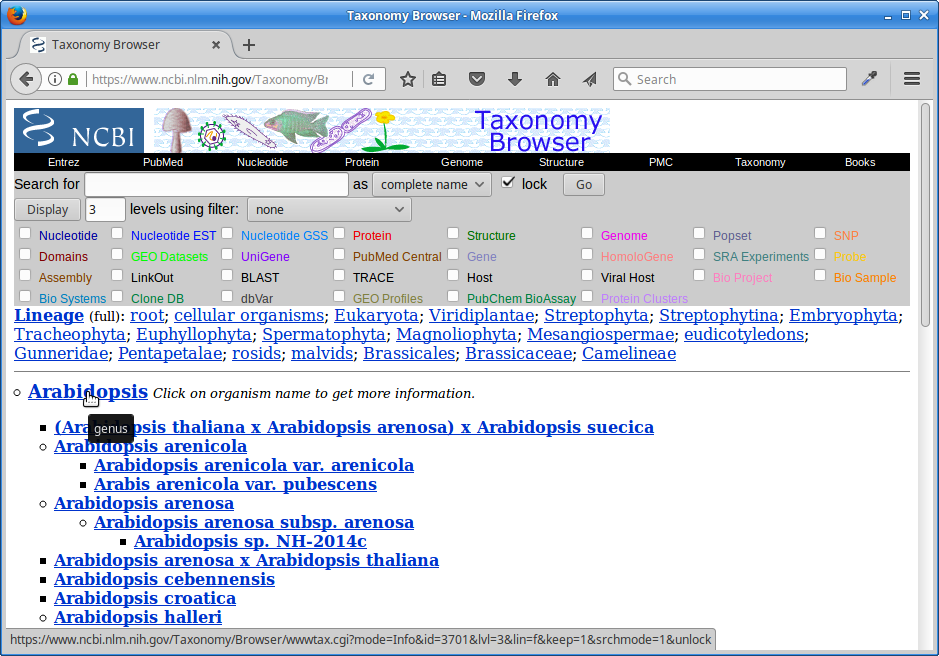
4.) Click on the “Subtree links” for Nucleotide
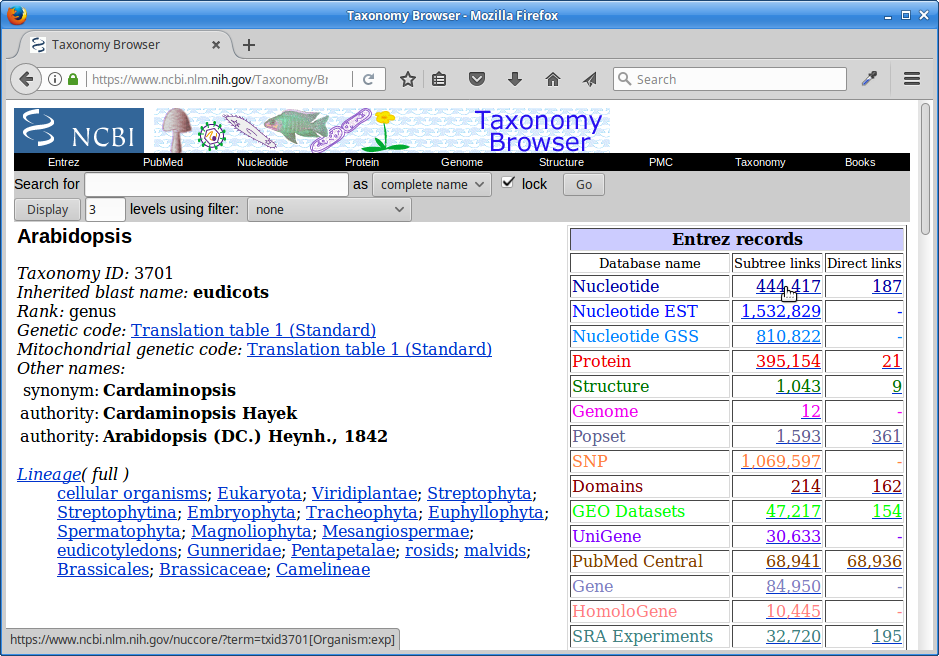
5.) Under Molecule Types, click on “rRNA”.
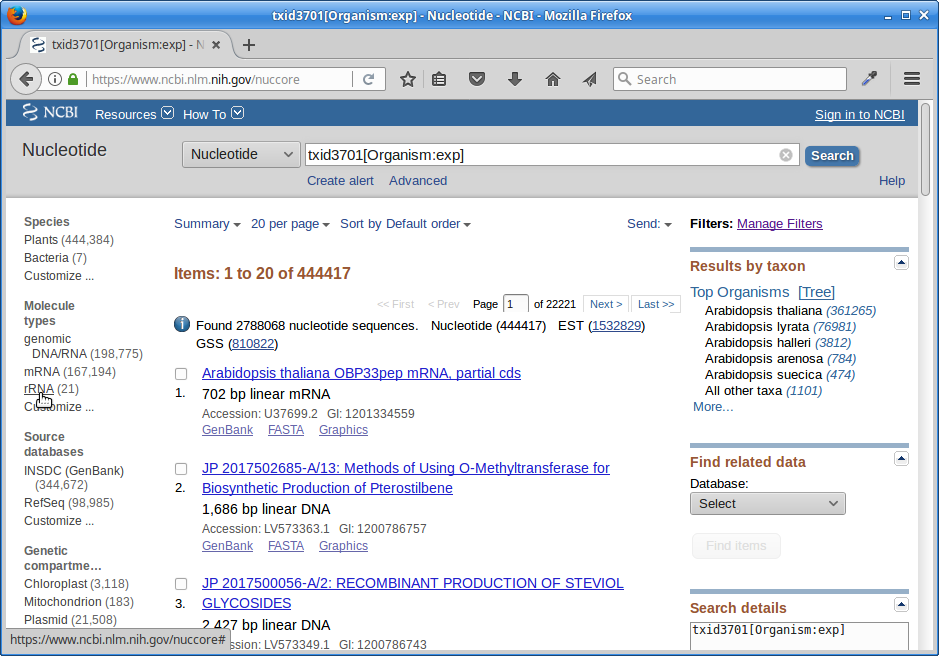
6.) Click on “Send”, choose “File”, choose Format “FASTA”, and click on “Create File”.
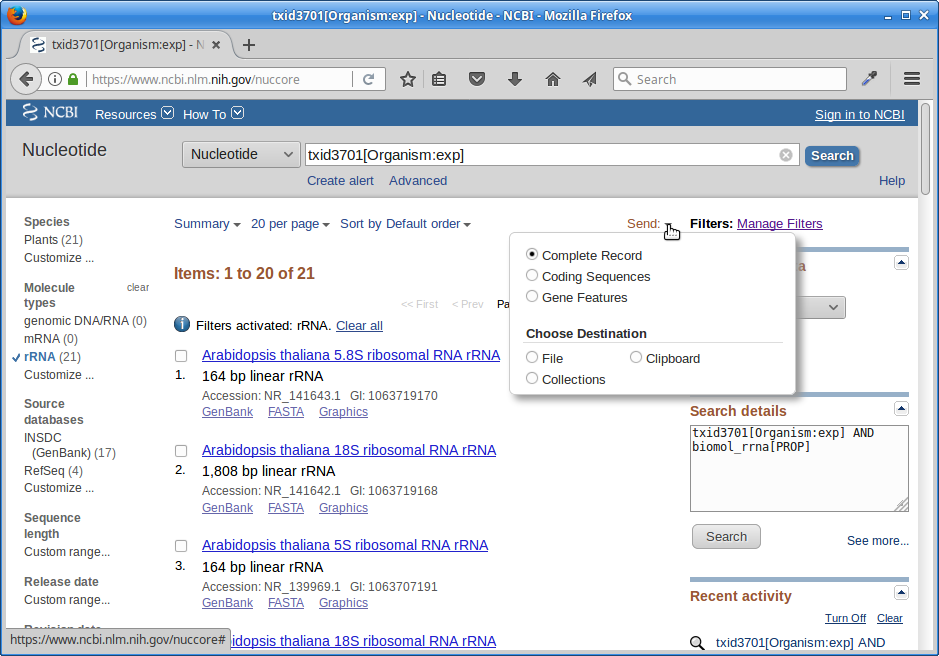
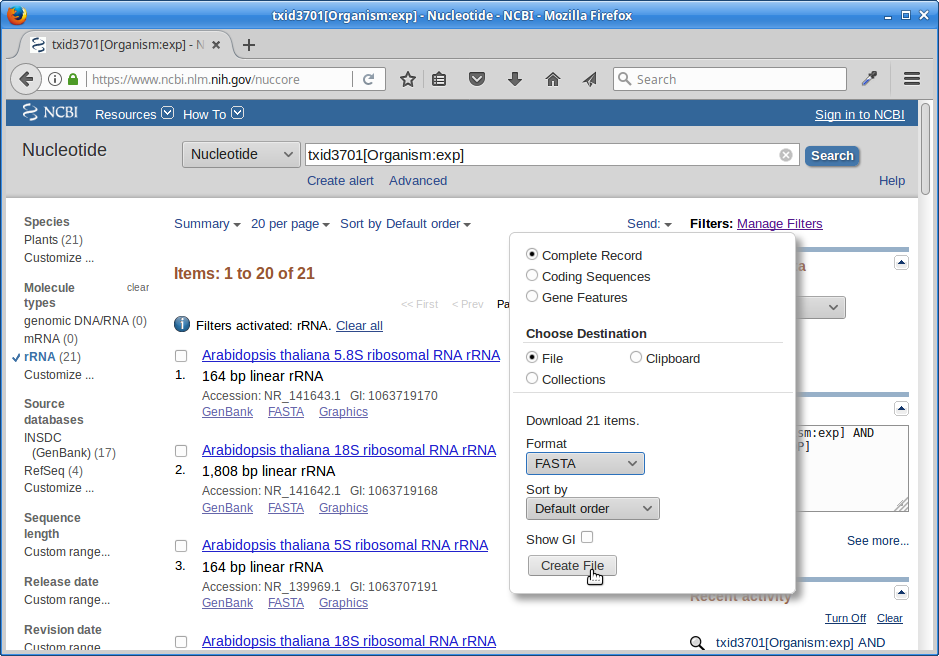
Save this file to your computer, and rename it to ‘rrna.fasta’.
Now, make a directory in your “variant_example” directory called “ref”:
cd /share/workshop/$USER/variant_example
mkdir ref
Upload your rrna.fasta file to the ‘ref’ directory on the cluster using either scp or FileZilla. Or if you feel like cheating, paste the contents of rrna.fa using nano into a file named variant_example/ref/rrna.fasta
nano ref/rrna.fasta # paste contents of rrna.fa and save
2b. Lets look for ribosomal rna, but not remove, so just count the occurrences.
First, view the help documentation for hts_SeqScreener
cd /share/workshop/$USER/variant_example/HTS_testing
hts_SeqScreener -h
msettles@ganesh: HTS_testing$hts_SeqScreener -h
HTStream <https://github.com/ibest/HTStream> application: hts_SeqScreener
Version: 0.3.1
hts_SeqScreener identifies and removes any reads which appear to have originated
  from a contaminant DNA source. Because bacteriophage Phi-X is common spiked
  into Illumina runs for QC purposes, sequences originating from Phi-X are removed
  by default. If other contaminants are suspected their sequence can be supplied
  as a fasta file <seq>, however the algorithm has been tuned for short contaminant
  sequences, and may not work well with sequences significantly longer than Phi-X (5Kb).


Standard Options:
  -v [ --version ]                      Version print
  -h [ --help ]                         Prints help documentation
  -N [ --notes ] arg                    Notes for the stats JSON
  -L [ --stats-file ] arg (=stats.log)  String for output stats file name
  -A [ --append-stats-file ]            Append to stats file

Input Options:
  -1 [ --read1-input ] arg              Read 1 paired end fastq input <space
                                        seperated for multiple files>
  -2 [ --read2-input ] arg              Read 2 paired end fastq input <space
                                        seperated for multiple files>
  -U [ --singleend-input ] arg          Single end read fastq input <space
                                        seperated for multiple files>
  -T [ --tab-input ] arg                Tab input <space seperated for multiple
                                        files>
  -I [ --interleaved-input ] arg        Interleaved fastq input <space
                                        seperated for multiple files>
  -S [ --from-stdin ]                   STDIN input <MUST BE TAB DELIMITED
                                        INPUT>

Output Options:
  -F [ --force ]                        Forces overwrite of files
  -p [ --prefix ] arg (=hts_SeqScreener)
                                        Prefix for output files
  -g [ --gzip-output ]                  Output gzipped files
  -f [ --fastq-output ]                 Output to Fastq format <PE AND/OR SE
                                        files>
  -t [ --tab-output ]                   Output to tab-delimited file format
  -i [ --interleaved-output ]           Output to interleaved fastq file <PE
                                        ONLY>
  -u [ --unmapped-output ]              Output to unmapped sam file format
  -O [ --to-stdout ]                    Output to STDOUT in tab-delimited file
                                        format

Application Specific Options:
  -s [ --seq ] arg                      Please supply a fasta file - default -
                                        Phix Sequence - default
                                        https://www.ncbi.nlm.nih.gov/nuccore/96
                                        26372
  -C [ --check-read-2 ]                 Check R2 as well as R1 (pe)
  -k [ --kmer ] arg (=12)               Kmer size of the lookup table (min 5,
                                        max 256)
  -x [ --percentage-hits ] arg (=0.25)  Proportion of kmer percentage-hits to
                                        sequence need to happen to discard (min
                                        0.0, max 1.0)
  -n [ --inverse ]                      Output reads that are ABOVE the kmer
                                        hit threshold
  -r [ --record ]                       Only record the reads that pass the
                                        kmer hit threshold, output all reads


Please report any issues, request for enhancement, or comments to <https://github.com/ibest/HTStream/issues>
What parameters are needed to 1) provide a reference to hts_SeqScreener and 2) count, and not screen occurrences?
hts_SeqScreener -1 A8100.subset.chr18.R1.fastq.gz \
                -2 A8100.subset.chr18.R2.fastq.gz \
                -s ../ref/rrna.fasta -r -L A8100.rrna.log -f -g -p A8100.rrna
Which files were generated from hts_SeqScreener?
Lets look at the file A8100.rrna.log?
What do you notice about the A8100.rrna.log?
How many reads were identified as rrna?
3. The power of htstream is the ability to stream reads through multiple programs using pipe’s.
By streaming reads through programs processing will be much quicker, each read is read in only once (written only once), and use significantly less storage as there are no intermediate files. It can do this by streaming a tab-delimited format called tab6.
Single end reads are 3 columns:
read1id read1seq read1qual
Paired end reads are 6 columns:
read1id read1seq read1qual read2id read2seq read2qual
So lets first run hts_Stats and then hts_SeqScreener in a streamed fashion.
cd /share/workshop/$USER/variant_example/HTS_testing

hts_Stats -1 A8100.subset.chr18.R1.fastq.gz \
          -2 A8100.subset.chr18.R2.fastq.gz \
          -L A8100.streamed.log -O |
hts_SeqScreener -S -A -L A8100.streamed.log \
          -r -s ../ref/rrna.fasta -f -g -p A8100.streamed
Note the pipe between the two applications!
What new parameters did we use here?
What parameter is SeqScreener using that specifies how reads are input?
4. A DNA preprocessing pipeline
- hts_Stats: get stats on raw reads
- hts_SeqScreener: screen out (remove) phiX
- hts_SuperDeduper: identify and remove PCR duplicates
- hts_AdapterTrimmer: identify and remove adapter sequence
- hts_QWindowTrim: remove poor quality sequence
- hts_NTrimmer: remove any remaining N characters
- hts_CutTrim: use to remove all reads < 50bp
- hts_Stats: get stats out output reads
4a. Why screen for phiX?
PhiX is a common control in Illumina runs, and facilities may not tell you if/when PhiX has been spiked in since it does not have a barcode, so in theory should not be in your data.
However:
- When I know PhiX has been spiked in, I find sequence every time
- [update] When dual matched barcodes are used, then near zero phiX reads identified.
- When I know PhiX has not been spiked in, I do not find sequence
For RNAseq and variant analysis (any mapping based technique) it is not critical to remove, but for sequence assembly it is. I think its better safe than sorry and screen for it every time.
4b. Removing PCR duplicates with hts_SuperDeduper.
Removing duplicates is standard practice in variant analysis. Removing PCR duplicates can be controversial for RNAseq, but I’m in favor of it. It tells you alot about the original complexity of each sample and potential impact of sequencing depth.
However, I would never do PCR duplicate removal on single-end reads
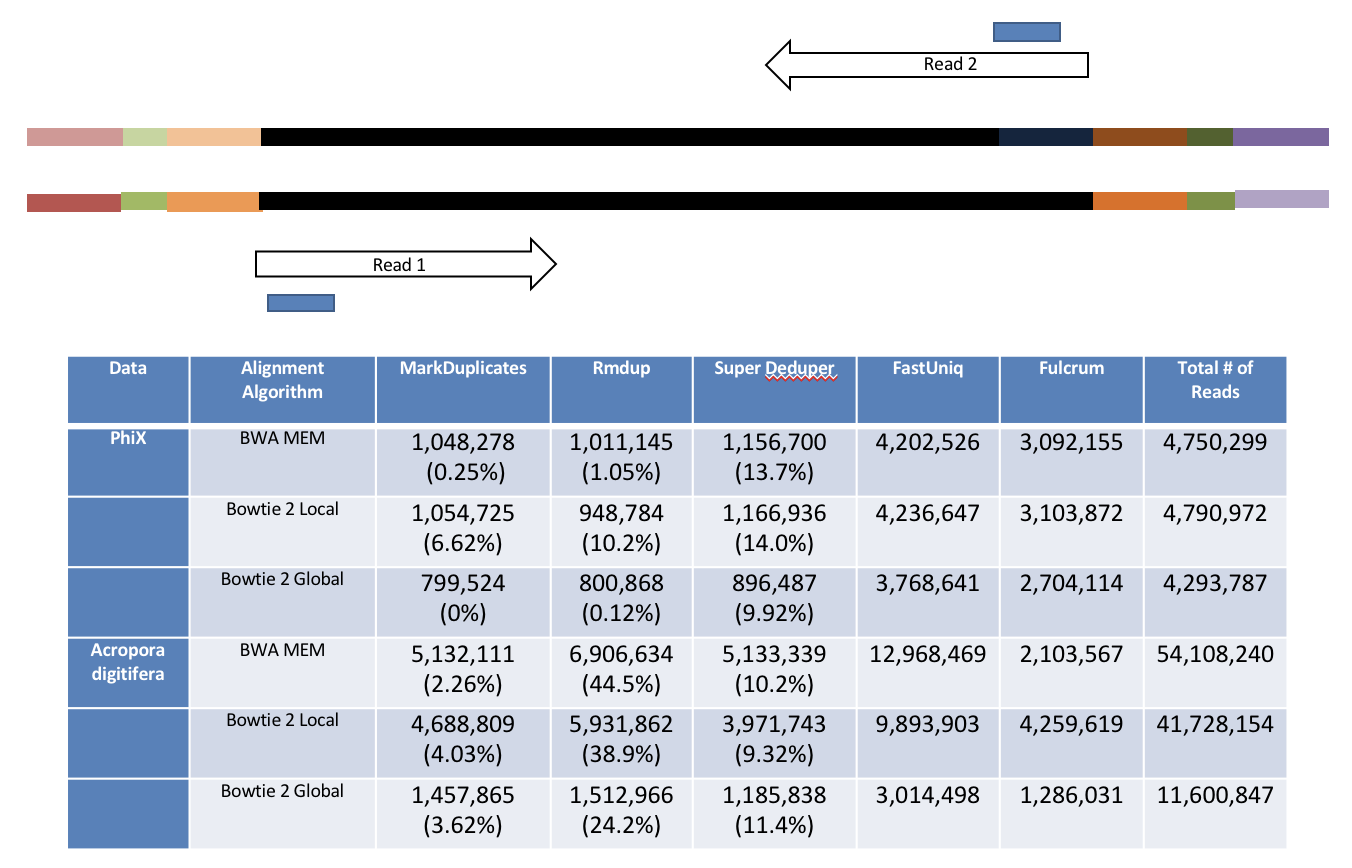
Super Deduper only uses a small portion of the reads to identify duplicates.
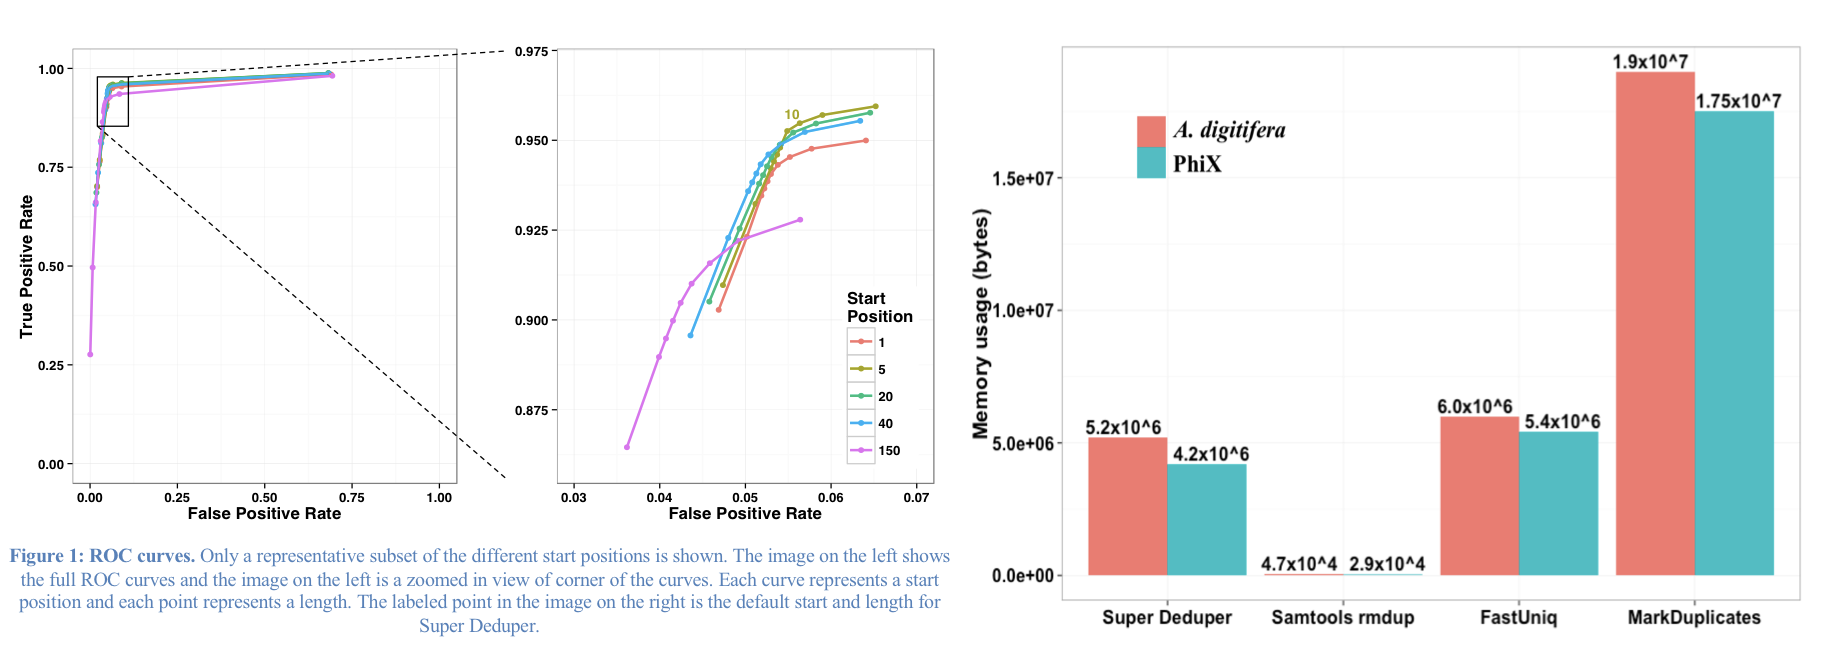
We calculated the Youden Index for every combination tested and the point that acquired the highest index value (as compared to Picard MarkDuplicates) occurred at a start position of 5bp and a length of 10bps (20bp total over both reads).
4c. Adapter trimming by overlapping reads.
Consider the three scenarios below
Insert size > length of the number of cycles
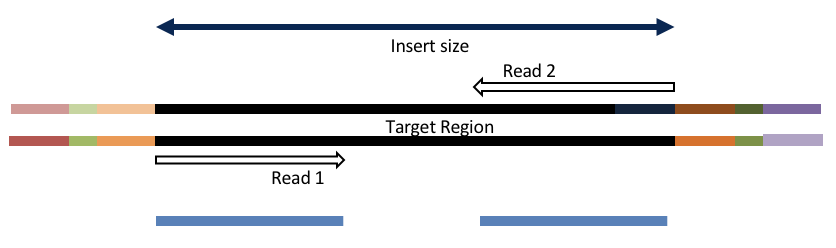
hts_AdapterTrimmer product: original pairs
hts_Overlapper product: original pairs
Insert size < length of the number of cycles (10bp min)
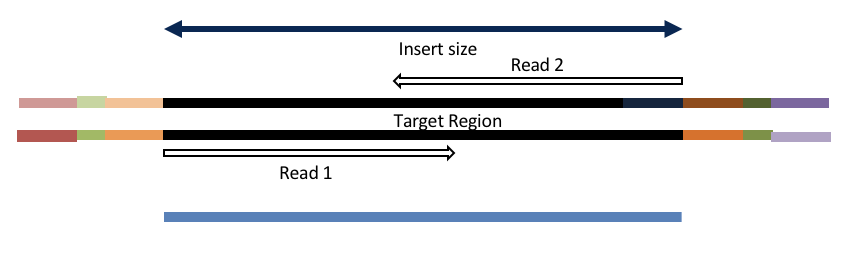
hts_AdapterTrimmer product: original pairs
hts_Overlapper product: extended, single
Insert size < length of the read length
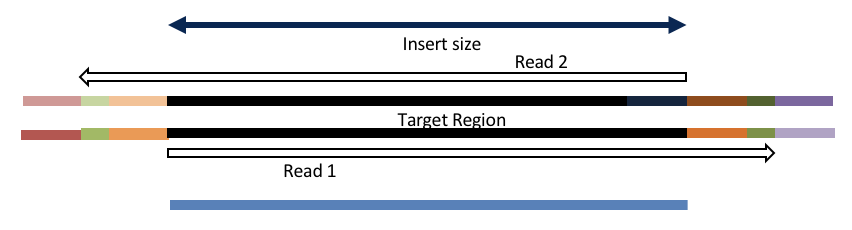
hts_AdapterTrimmer product: adapter trimmed, pairs
hts_Overlapper product: adapter trimmed, single
Both hts_AdapterTrimmer and hts_Overlapper employ this principle to identify and remove adapters for paired-end reads. For paired-end reads the difference between the two are the output, as overlapper produces single-end reads when the pairs overlap and adapter trimmer keeps the paired end format. For single-end reads, adapter trimmer identifies and removes adapters by looking for the adapter sequence, where overlapper just ignores single-end reads (nothing to overlap).
4d. Q-window trimming.
As a sequencing run progresses the quality scores tend to get worse, so its common to trim of the worst quality bases.
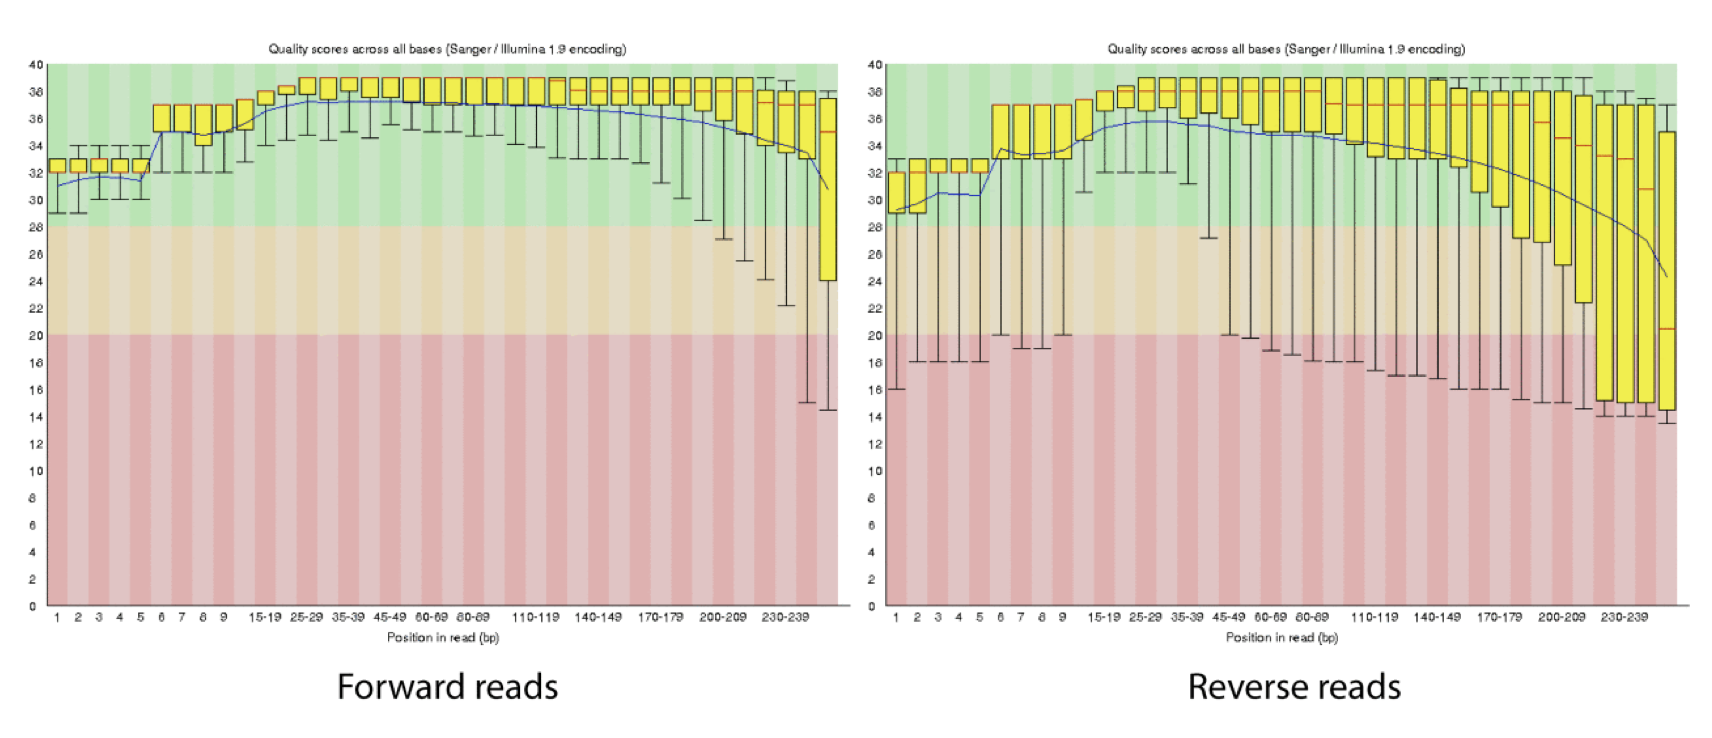
This is how reads commonly look, the start at “good” quality, increase to “excellent” and degrade to “poor”, with R2 always looking worse (except when they don’t) than R1 and get worse as the number of cycles increases.
hts_QWindowTrim trim 5’ and/or 3’ end of the sequence using a windowing (average quality in window) approach.
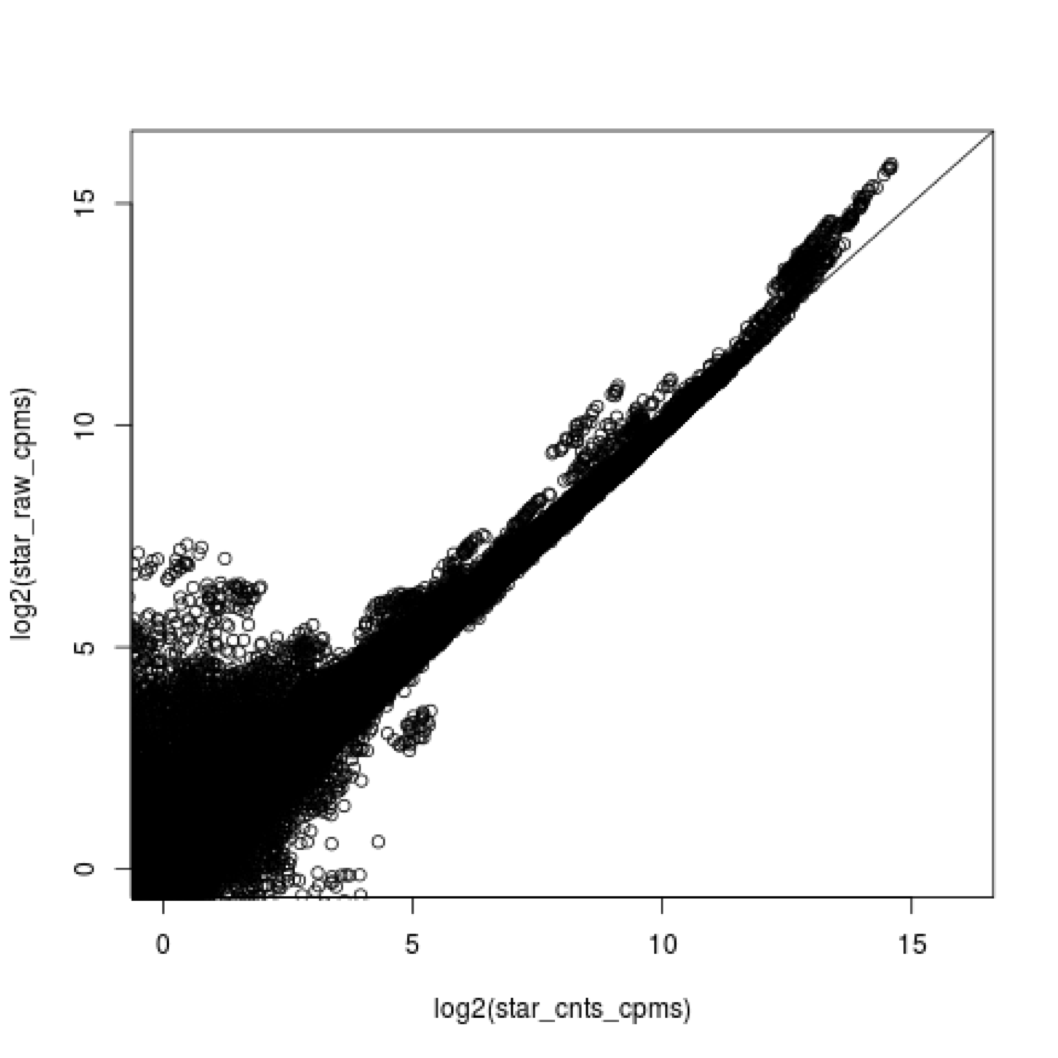
4e. what does all this preprocessing get you
Comparing star mapping with raw and preprocessed reads
5. Lets put it all together
hts_Stats -O -L A8100_htsStats.log -1 A8100.subset.chr18.R1.fastq.gz -2 A8100.subset.chr18.R2.fastq.gz | \
hts_SeqScreener -S -O -A -L A8100_htsStats.log | \
hts_SuperDeduper -e 250000 -S -O -A -L A8100_htsStats.log | \
hts_AdapterTrimmer -n -S -O -A -L A8100_htsStats.log | \
hts_QWindowTrim -n -S -O -A -L A8100_htsStats.log | \
hts_NTrimmer -n -S -O -A -L A8100_htsStats.log | \
hts_CutTrim -n -m 50 -S -O -A -L A8100_htsStats.log | \
hts_Stats -S -A -L A8100_htsStats.log -g -p A8100.htstream
Note the patterns:
- In the first routine we use -1 and -2 to specify the original reads and -O to output to standard output.
- In the middle routines we use -S to read in from standard input and -O to write out to standard output.
- In the final routine we use -S to read in from standard input and -g (gzipped output) and -p fastq prefix to write out new preprocessed reads.
- For the log, we specify -L with the same log file name for all routines, and use -A for the second routine onward to append log output, generating a single log file at the end.
- All other parameters are algorithm specific, can review using –help
Review the final json output, how many reads do we have left?
Confirm that number by counting the number of reads in the final output files.
How many adapters did we detect, cut off?
How many PCR duplicates were there?
Anything else interesting?
Spend some time playing with applications and arguments, change things up!
6. We can now run the preprocessing routine across all samples on the real data using a SLURM script, hts_preproc.slurm, that we should take a look at now.
cd /share/workshop/$USER/variant_example  # We'll run this from the main directory
wget https://raw.githubusercontent.com/ucdavis-bioinformatics-training/2018-August-Variant-Analysis-Workshop/master/tuesday/hts_preproc.slurm
cat hts_preproc.slurm
mkdir slurmout
After looking at the script, lets make a slurmout directory for the output to go and let’s run it. First we’ll need to produce a list of samples for the script to work on.
sbatch hts_preproc.slurm # moment of truth!
We can watch the progress of our task array using the ‘squeue’ command. Takes less than 10 minutes to process each sample.
squeue -u $USER # use your actual username, no brackets
Preprocessing statistics as QA/QC.
Beyond generating “better” data for downstream analysis, cleaning statistics also give you an idea as to the original quality and complexity of the sample, library generation, and sequencing quality.
This can help inform you of how you might change your procedures in the future, either sample preparation, or in library preparation.
I’ve found it best to perform QA/QC on both the run as a whole (poor samples can affect other samples) and on the samples themselves as they compare to other samples (BE CONSISTENT).
Reports such as Basespace for Illumina, are great ways to evaluate the run as a whole, the sequencing provider usually does this for you. PCA/MDS plots of the preprocessing summary are a great way to look for technical bias across your experiment. Poor quality samples often appear as outliers on the MDS plot and can ethically be removed due to identified technical issues.
1. Let’s make sure that all jobs completed successfully.
Lets first check all the “htstream_%*.out” and “htstream_%*.err” files:
cd /share/workshop/$USER/variant_example
cat slurmout/htstream_*.out
Look through the output and make sure you don’t see any errors. Now do the same for the err files:
cat slurmout/htstream_*.err
Also, check the output files. First check the number of forward and reverse output files (should be 5 each):
cd 01-HTS_Preproc
ls */*R1* | wc -l
ls */*R2* | wc -l
Check the sizes of the files as well. Make sure there are no zero or near-zero size files and also make sure that the size of the files are in the same ballpark as each other:
ls -lh *
If, for some reason, your jobs did not finish or something else went wrong, please let one of us know and we will help.
2. Let’s take a look at the differences between the input and output files. First look at the input file:
cd /share/workshop/$USER/variant_example
less 00-RawData/A8100/A8100.chr18.R1.fastq
Let’s search for the adapter sequence. Type ‘/’ (a forward slash), and then type AGATCGGAAGAGCACACGTCTGAACTCCAGTCAC (the first part of the forward adapter). Press Enter. This will search for the sequence in the file and highlight each time it is found. You can now type “n” to cycle through the places where it is found. When you are done, type “q” to exit.
Now look at the output file, zless this time since its gzipped:
zless 01-HTS_Preproc/A8100/A8100_R1.fastq.gz
If you scroll through the data (using the spacebar), you will see that some of the sequences have been trimmed. Now, try searching for AGATCGGAAGAGCACACGTCTGAACTCCAGTCAC again. You shouldn’t find it (adapters were trimmed remember). You may need to use Control-C to get out of the search and then “q” to exit the ‘less’ screen.
3. QA/QC Summary table of the json files.
I’ve created a small R script to read in each json file, pull out some relevant stats and write out a table for all samples, we will use the app ‘wget’ to copy the script from the internet.
cd /share/workshop/$USER/variant_example  # We'll run this from the main directory
wget https://raw.githubusercontent.com/ucdavis-bioinformatics-training/2018-August-Variant-Analysis-Workshop/master/tuesday/summarize_stats.R

module load R/3.5.0
R CMD BATCH summarize_stats.R
cat summary_hts.txt
Lets move this file to our computer, using scp or winSCP, or copy/paste from cat [sometimes doesn’t work], open in excel (or excel like application), you may have to move the header column 1 cell to the right, and lets review.
Any problematic samples?
Anything else worth discussing?
4. Scripts
slurm script for preprocessing using slurm task array and htstream
shell script for preprocessing using bash loop and htstream.
R script to produce summary table, assumes exact htstream operations and order as described above.