
Part 5: Enrichment, Model-Based DE, and Cell-Type Identification
Load libraries
library(Seurat)
library(ggplot2)
library(limma)
library(topGO)
Load the Seurat object
load("clusters_seurat_object.RData")
experiment.merged
## An object of class Seurat
## 21005 features across 10595 samples within 1 assay
## Active assay: RNA (21005 features, 5986 variable features)
##  3 dimensional reductions calculated: pca, tsne, umap
Idents(experiment.merged) <- "finalcluster"
1. Gene Ontology (GO) Enrichment of Genes Expressed in a Cluster
Gene Ontology provides a controlled vocabulary for describing gene products. Here we use enrichment analysis to identify GO terms that are overrepresented among the gene expressed in cells in a given cluster.
cluster12 <- subset(experiment.merged, idents = '12')
expr <- as.matrix(GetAssayData(cluster12))
# Filter out genes that are 0 for every cell in this cluster
bad <- which(rowSums(expr) == 0)
expr <- expr[-bad,]

# Select genes that are expressed > 0 in at least half of cells
n.gt.0 <- apply(expr, 1, function(x)length(which(x > 0)))
expressed.genes <- rownames(expr)[which(n.gt.0/ncol(expr) >= 0.5)]
all.genes <- rownames(expr)

# define geneList as 1 if gene is in expressed.genes, 0 otherwise
geneList <- ifelse(all.genes %in% expressed.genes, 1, 0)
names(geneList) <- all.genes

# Create topGOdata object
	GOdata <- new("topGOdata",
		ontology = "BP", # use biological process ontology
		allGenes = geneList,
		geneSelectionFun = function(x)(x == 1),
              annot = annFUN.org, mapping = "org.Hs.eg.db", ID = "symbol")
# Test for enrichment using Fisher's Exact Test
	resultFisher <- runTest(GOdata, algorithm = "elim", statistic = "fisher")
	GenTable(GOdata, Fisher = resultFisher, topNodes = 20, numChar = 60)
##         GO.ID                                                            Term Annotated Significant Expected  Fisher
## 1  GO:0050861        positive regulation of B cell receptor signaling pathway         7           2     0.01 8.6e-05
## 2  GO:0072659                         protein localization to plasma membrane       236           5     0.49 0.00010
## 3  GO:0050852                               T cell receptor signaling pathway       125           4     0.26 0.00012
## 4  GO:0050727                             regulation of inflammatory response       235           4     0.49 0.00127
## 5  GO:0021762                                    substantia nigra development        32           2     0.07 0.00196
## 6  GO:0000304                                      response to singlet oxygen         1           1     0.00 0.00207
## 7  GO:0042351                     'de novo' GDP-L-fucose biosynthetic process         1           1     0.00 0.00207
## 8  GO:2000473        positive regulation of hematopoietic stem cell migration         1           1     0.00 0.00207
## 9  GO:0051623                    positive regulation of norepinephrine uptake         1           1     0.00 0.00207
## 10 GO:0032745                positive regulation of interleukin-21 production         1           1     0.00 0.00207
## 11 GO:0072749                             cellular response to cytochalasin B         1           1     0.00 0.00207
## 12 GO:1905475                  regulation of protein localization to membrane       139           3     0.29 0.00284
## 13 GO:0034113                                  heterotypic cell-cell adhesion        45           2     0.09 0.00385
## 14 GO:1903615    positive regulation of protein tyrosine phosphatase activity         2           1     0.00 0.00414
## 15 GO:0031022                           nuclear migration along microfilament         2           1     0.00 0.00414
## 16 GO:0021817 nucleokinesis involved in cell motility in cerebral cortex r...         2           1     0.00 0.00414
## 17 GO:0002728 negative regulation of natural killer cell cytokine producti...         2           1     0.00 0.00414
## 18 GO:0044855                               plasma membrane raft distribution         2           1     0.00 0.00414
## 19 GO:1905430                                    cellular response to glycine         2           1     0.00 0.00414
## 20 GO:0001954                     positive regulation of cell-matrix adhesion        48           2     0.10 0.00437
- Annotated: number of genes (out of all.genes) that are annotated with that GO term
- Significant: number of genes that are annotated with that GO term and meet our criteria for “expressed”
- Expected: Under random chance, number of genes that would be expected to be annotated with that GO term and meeting our criteria for “expressed”
- Fisher: (Raw) p-value from Fisher’s Exact Test
Quiz 1
Challenge Questions
If you have extra time:
- Rerun the enrichment analysis for the molecular function (MF) ontology.
- Think about how you write code to repeat the above enrichment analysis for every cluster (hint: ?base::sapply).
2. Model-based DE analysis in limma
limma is an R package for differential expression analysis of bulk RNASeq and microarray data. We apply it here to single cell data.
Limma can be used to fit any linear model to expression data and is useful for analyses that go beyond two-group comparisons. A detailed tutorial of model specification in limma is available here and in the limma User’s Guide.
# filter genes to those expressed in at least 10% of cells
keep <- rownames(expr)[which(n.gt.0/ncol(expr) >= 0.1)]
expr2 <- expr[keep,]

# Set up "design matrix" with statistical model
cluster12$proper.ident <- make.names(cluster12$orig.ident)
mm <- model.matrix(~0 + proper.ident + S.Score + G2M.Score + percent.mito + nFeature_RNA, data = cluster12[[]])
head(mm)
##                             proper.identA001.C.007 proper.identA001.C.104 proper.identB001.A.301      S.Score   G2M.Score percent.mito nFeature_RNA
## AAACCCACAGAAGTTA_A001-C-007                      1                      0                      0  0.016243559 -0.05567510    1.6666667          466
## AAACGCTAGGAGCAAA_A001-C-007                      1                      0                      0 -0.059688163  0.01823853    2.0519836          626
## AAACGCTTCTCTGCTG_A001-C-007                      1                      0                      0  0.244774911  0.74333121    1.1502030         1104
## AAAGAACCACGAAGAC_A001-C-007                      1                      0                      0 -0.003307564  0.09956644    1.4218009          535
## AACAGGGGTCCCTGAG_A001-C-007                      1                      0                      0 -0.035800756  0.01552573    0.7968127          744
## AAGGTAATCCTCAGAA_A001-C-007                      1                      0                      0 -0.062652203  0.04392439    0.9419152          546
tail(mm)
##                             proper.identA001.C.007 proper.identA001.C.104 proper.identB001.A.301     S.Score    G2M.Score percent.mito nFeature_RNA
## TTCCGTGTCCGCTGTT_B001-A-301                      0                      0                      1 -0.08190609 -0.045416409    0.6387509         1064
## TTCTGTACATAGACTC_B001-A-301                      0                      0                      1  0.02359308 -0.056658892    0.3048780          536
## TTCTTCCAGTCCCAAT_B001-A-301                      0                      0                      1  0.02491281 -0.088061413    0.3700278          862
## TTGGATGCACGGTGCT_B001-A-301                      0                      0                      1 -0.04342491  0.071349069    0.9578544          451
## TTTACGTGTGTCTTAG_B001-A-301                      0                      0                      1 -0.09985271 -0.093126270    0.5780347          942
## TTTCGATAGACAACAT_B001-A-301                      0                      0                      1  0.04867999  0.004383793    0.4915730         2371
# Fit model in limma
fit <- lmFit(expr2, mm)
head(coef(fit))
##        proper.identA001.C.007 proper.identA001.C.104 proper.identB001.A.301    S.Score  G2M.Score percent.mito  nFeature_RNA
## CCNL2               0.2396261           -0.006494329             0.05299145  0.1177847 -0.3851735  0.099257545  0.0003433512
## CDK11A              0.6641791            0.089012473             0.09024772 -0.6450108  0.6608372 -0.013579988  0.0001919251
## GNB1                0.5498174            0.363893455             0.38644072  0.2396164  0.2658143 -0.001826895  0.0004433892
## SKI                 0.2285806            0.398793577            -0.12774089 -0.1044831 -0.4867745 -0.059676145  0.0002570741
## KCNAB2              0.4760345            0.765881330             0.54504314  0.9751246  0.6724686 -0.103461311 -0.0001717929
## CAMTA1             -0.1310409           -0.095618782             0.07542118 -0.4560094 -0.4501812 -0.002074261  0.0004712436
# Test 'B001-A-301' - 'A001-C-007'
contr <- makeContrasts(proper.identB001.A.301 - proper.identA001.C.007, levels = colnames(coef(fit)))
contr
##                         Contrasts
## Levels                   proper.identB001.A.301 - proper.identA001.C.007
##   proper.identA001.C.007                                              -1
##   proper.identA001.C.104                                               0
##   proper.identB001.A.301                                               1
##   S.Score                                                              0
##   G2M.Score                                                            0
##   percent.mito                                                         0
##   nFeature_RNA                                                         0
fit2 <- contrasts.fit(fit, contrasts = contr)
fit2 <- eBayes(fit2)
out <- topTable(fit2, n = Inf, sort.by = "P")
head(out, 30)
##               logFC   AveExpr         t      P.Value    adj.P.Val         B
## SLC26A2   3.0491797 1.0629482 17.062816 1.279092e-47 2.475042e-44 96.842841
## GUCA2A    1.6316995 0.4334461 11.246381 3.615387e-25 3.497887e-22 46.344851
## PHGR1     1.9817254 0.7501501 10.812613 1.263317e-23 8.148397e-21 42.872558
## XIST      1.3225033 0.3657630 10.380945 4.060678e-22 1.702613e-19 39.482858
## SLC26A3   1.8205559 0.6555777 10.370872 4.399517e-22 1.702613e-19 39.404586
## PDE3A     1.4273415 0.4332776  9.692689 8.833021e-20 2.848649e-17 34.228170
## CKB       2.0132899 1.4913849  8.459897 7.999548e-16 2.211304e-13 25.345494
## PIGR      1.9395745 1.3447380  8.150402 6.989238e-15 1.690522e-12 23.235771
## ATP1A1    1.4142129 0.6672922  7.771705 9.228991e-14 1.984233e-11 20.726518
## CLCA4     1.0457945 0.3366567  7.582066 3.258275e-13 6.304761e-11 19.501071
## MT-CO2   -1.5085157 2.7289681 -7.503861 5.447945e-13 9.583431e-11 19.001933
## MUC12     1.2542062 0.5705467  7.222223 3.364764e-12 5.425683e-10 17.235244
## TMSB4X    1.4108471 1.0055437  6.294871 9.469176e-10 1.409450e-07 11.778234
## FTH1      1.1423795 0.6892685  6.268453 1.102695e-09 1.519892e-07 11.631283
## CCND3     1.5327817 1.3641127  6.256938 1.178211e-09 1.519892e-07 11.567378
## S100A6    1.4073711 0.9677000  6.161607 2.031648e-09 2.457025e-07 11.041922
## CEACAM7   0.9032732 0.3321876  6.006647 4.859850e-09 5.531652e-07 10.201561
## NXPE1     1.0027720 0.4764160  5.894184 9.055717e-09 9.734896e-07  9.602475
## FKBP5     1.3994918 1.3421646  5.776481 1.720380e-08 1.752071e-06  8.985344
## FABP1     1.0951597 0.5854007  5.710409 2.455702e-08 2.375892e-06  8.643388
## HSP90AA1 -1.1122036 0.6331681 -5.655640 3.290375e-08 3.031846e-06  8.362388
## PIP4K2A   1.3017235 1.1825719  5.524949 6.555718e-08 5.766052e-06  7.700923
## PARP8     1.2093942 0.9387516  5.482825 8.164914e-08 6.869178e-06  7.490466
## SELENOP   0.8384054 0.3588361  5.438166 1.028959e-07 8.295982e-06  7.268813
## MUC13     0.9862040 0.5686166  5.423396 1.110395e-07 8.594456e-06  7.195839
## B2M       1.2463700 1.0201418  5.398320 1.263212e-07 9.211562e-06  7.072330
## NCL      -0.8912419 0.4153055 -5.394937 1.285334e-07 9.211562e-06  7.055704
## RNF213   -1.3405337 1.4710884 -5.370101 1.459659e-07 1.008729e-05  6.933916
## FRYL      1.1859519 1.1869102  5.063632 6.749130e-07 4.503299e-05  5.470366
## TSPAN1    0.6987805 0.2775711  4.992235 9.543618e-07 6.155634e-05  5.139976
Output columns:
- logFC: log fold change (since we are working with Seurat’s natural log transformed data, will be natural log fold change)
- AveExpr: Average expression across all cells in expr2
- t: logFC divided by its standard error
- P.Value: Raw p-value (based on t) from test that logFC differs from 0
- adj.P.Val: Benjamini-Hochberg false discovery rate adjusted p-value
- B: log-odds that gene is DE
Quiz 2
BONUS: Cell type identification with scMRMA
scMRMA (single cell Multi-Resolution Marker-based Annotation Algorithm) classifies cells by iteratively clustering them then annotating based on a hierarchical external database.
The databases included with the current version are only for use with human and mouse, but a user-constructed hierarchichal database can be used.
The package can be installed from Github:
# Remove hashes to run
# install.packages("devtools")
# devtools::install_github("JiaLiVUMC/scMRMA")
suppressPackageStartupMessages(library(scMRMA))
result <- scMRMA(input = experiment.merged,
                 species = "Hs",
                 db = "panglaodb")
## Pre-defined cell type database panglaodb will be used.
## Multi Resolution Annotation Started.
## Level 1 annotation started.
## Level 2 annotation started.
## Level 3 annotation started.
## Level 4 annotation started.
## Uniform Resolution Annotation Started.
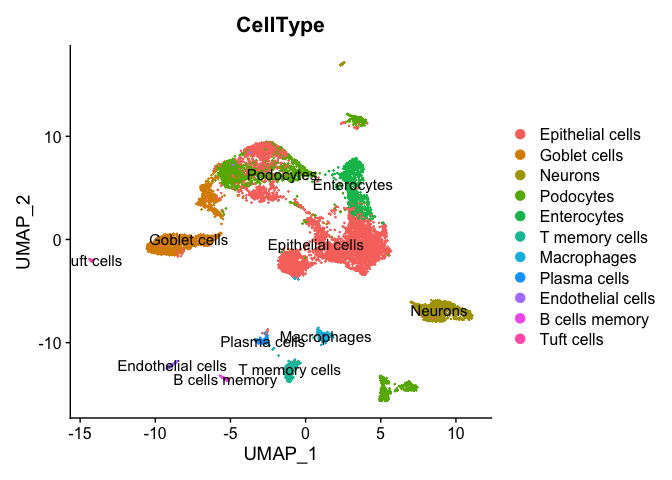
table(result$uniformR$annotationResult)
## UniformR
##  Epithelial cells      Goblet cells           Neurons         Podocytes       Enterocytes    T memory cells       Macrophages      Plasma cells Endothelial cells    B cells memory        Tuft cells
##              4556              1356               978              1992               819               329               195               142                99                80                49
## Add cell types to metadata
experiment.merged <- AddMetaData(experiment.merged, result$uniformR$annotationResult, col.name = "CellType")
table(experiment.merged$CellType, experiment.merged$orig.ident)
##
##                     A001-C-007 A001-C-104 B001-A-301
##   Epithelial cells         202       1315       3039
##   Goblet cells              56        361        939
##   Neurons                  936         10         32
##   Podocytes                319       1292        381
##   Enterocytes                0         20        799
##   T memory cells            79        164         86
##   Macrophages               94         64         37
##   Plasma cells              75         44         23
##   Endothelial cells          7         51         41
##   B cells memory             4         49         27
##   Tuft cells                 2         46          1
table(experiment.merged$CellType, experiment.merged$finalcluster)
##
##                        0    3    1    2    4    5    6    7    8    9   10   11   12   13   14   15   16   17   18   19   20   22   23   24   26
##   Epithelial cells  1178  133   12  885   21  673  551  174    6  227  356   13    4    1  263    1   10    2    1    7    0    0    0    0   38
##   Goblet cells         2   28    0    1  668    2    2    5    1    0    7  370    0  268    2    0    0    0    0    0    0    0    0    0    0
##   Neurons              0    1  909    2    1    2    0    5    0    0    7    0    3    0    1    0    0    3    0    0    0    0    0   44    0
##   Podocytes            2  757    1    1    0    1  117  452    1    1   25    5    0    0    5  269  199    0  156    0    0    0    0    0    0
##   Enterocytes          5    0    0    2    0    1    0    4  626  177    0    0    1    3    0    0    0    0    0    0    0    0    0    0    0
##   T memory cells       0    0    0    0    0    1    2    0    0    0    3    0  317    0    0    0    0    5    0    1    0    0    0    0    0
##   Macrophages          0    0    0    4    0    2    0    0    0    0    0    0    3    0    0    0    0  186    0    0    0    0    0    0    0
##   Plasma cells         0    0    0    0    0    0    1    0    0    0    1    1    1    0    0    0    0    0    0  138    0    0    0    0    0
##   Endothelial cells    0    2    1    0    0    0    1    0    0    0    2    0    0    0    0    0    0    0    0    0   92    1    0    0    0
##   B cells memory       0    0    0    0    0    0    0    0    0    0    0    0    1    0    0    0    0    0    0    0    0   79    0    0    0
##   Tuft cells           0    0    0    0    0    0    0    0    0    0    0    0    0    0    0    0    0    0    0    0    0    0   49    0    0
DimPlot(experiment.merged, group.by = "CellType", label = TRUE)
Get the next Rmd file
download.file("https://raw.githubusercontent.com/ucdavis-bioinformatics-training/2022-December-Single-Cell-RNA-Seq-Analysis/main/data_analysis/scRNA_Workshop-PART6.Rmd", "scRNA_Workshop-PART6.Rmd")
Session Information
sessionInfo()
## R version 4.2.2 (2022-10-31)
## Platform: x86_64-apple-darwin17.0 (64-bit)
## Running under: macOS Catalina 10.15.7
##
## Matrix products: default
## BLAS:   /Library/Frameworks/R.framework/Versions/4.2/Resources/lib/libRblas.0.dylib
## LAPACK: /Library/Frameworks/R.framework/Versions/4.2/Resources/lib/libRlapack.dylib
##
## locale:
## [1] en_US.UTF-8/en_US.UTF-8/en_US.UTF-8/C/en_US.UTF-8/en_US.UTF-8
##
## attached base packages:
## [1] stats4    stats     graphics  grDevices utils     datasets  methods   base
##
## other attached packages:
##  [1] scMRMA_1.0           networkD3_0.4        data.tree_1.0.0      tidyr_1.2.1          RANN_2.6.1           plyr_1.8.8           irlba_2.3.5.1        Matrix_1.5-3         org.Hs.eg.db_3.16.0  topGO_2.50.0         SparseM_1.81         GO.db_3.16.0         AnnotationDbi_1.60.0 IRanges_2.32.0       S4Vectors_0.36.0     Biobase_2.58.0       graph_1.76.0         BiocGenerics_0.44.0  limma_3.54.0         ggplot2_3.4.0        SeuratObject_4.1.3
## [22] Seurat_4.3.0
##
## loaded via a namespace (and not attached):
##   [1] igraph_1.3.5           lazyeval_0.2.2         sp_1.5-1               splines_4.2.2          listenv_0.8.0          scattermore_0.8        usethis_2.1.6          GenomeInfoDb_1.34.3    digest_0.6.30          htmltools_0.5.3        fansi_1.0.3            magrittr_2.0.3         memoise_2.0.1          tensor_1.5             cluster_2.1.4          ROCR_1.0-11            remotes_2.4.2          globals_0.16.2         Biostrings_2.66.0
##  [20] matrixStats_0.63.0     spatstat.sparse_3.0-0  prettyunits_1.1.1      colorspace_2.0-3       blob_1.2.3             ggrepel_0.9.2          xfun_0.35              dplyr_1.0.10           callr_3.7.3            RCurl_1.98-1.9         crayon_1.5.2           jsonlite_1.8.4         progressr_0.11.0       spatstat.data_3.0-0    survival_3.4-0         zoo_1.8-11             glue_1.6.2             polyclip_1.10-4        gtable_0.3.1
##  [39] zlibbioc_1.44.0        XVector_0.38.0         leiden_0.4.3           pkgbuild_1.4.0         future.apply_1.10.0    abind_1.4-5            scales_1.2.1           DBI_1.1.3              spatstat.random_3.0-1  miniUI_0.1.1.1         Rcpp_1.0.9             viridisLite_0.4.1      xtable_1.8-4           reticulate_1.26        bit_4.0.5              profvis_0.3.7          htmlwidgets_1.5.4      httr_1.4.4             RColorBrewer_1.1-3
##  [58] ellipsis_0.3.2         ica_1.0-3              farver_2.1.1           urlchecker_1.0.1       pkgconfig_2.0.3        sass_0.4.4             uwot_0.1.14            deldir_1.0-6           utf8_1.2.2             labeling_0.4.2         tidyselect_1.2.0       rlang_1.0.6            reshape2_1.4.4         later_1.3.0            munsell_0.5.0          tools_4.2.2            cachem_1.0.6           cli_3.4.1              generics_0.1.3
##  [77] RSQLite_2.2.19         devtools_2.4.5         ggridges_0.5.4         evaluate_0.18          stringr_1.4.1          fastmap_1.1.0          yaml_2.3.6             goftest_1.2-3          processx_3.8.0         fs_1.5.2               knitr_1.41             bit64_4.0.5            fitdistrplus_1.1-8     purrr_0.3.5            KEGGREST_1.38.0        pbapply_1.6-0          future_1.29.0          nlme_3.1-160           mime_0.12
##  [96] compiler_4.2.2         rstudioapi_0.14        plotly_4.10.1          png_0.1-8              spatstat.utils_3.0-1   tibble_3.1.8           bslib_0.4.1            stringi_1.7.8          highr_0.9              ps_1.7.2               lattice_0.20-45        vctrs_0.5.1            pillar_1.8.1           lifecycle_1.0.3        spatstat.geom_3.0-3    lmtest_0.9-40          jquerylib_0.1.4        RcppAnnoy_0.0.20       bitops_1.0-7
## [115] data.table_1.14.6      cowplot_1.1.1          httpuv_1.6.6           patchwork_1.1.2        R6_2.5.1               promises_1.2.0.1       KernSmooth_2.23-20     gridExtra_2.3          parallelly_1.32.1      sessioninfo_1.2.2      codetools_0.2-18       pkgload_1.3.2          MASS_7.3-58.1          assertthat_0.2.1       withr_2.5.0            sctransform_0.3.5      GenomeInfoDbData_1.2.9 parallel_4.2.2         grid_4.2.2
## [134] rmarkdown_2.18         Rtsne_0.16             spatstat.explore_3.0-5 shiny_1.7.3