
Sequence Preprocessing
This document assumes project_setup has been completed.
cd /share/workshop/mrnaseq_workshop/$USER/rnaseq_example
Why Preprocess Reads
We have found that aggressively “cleaning” and preprocessing of reads can make a large difference to the speed and quality of mapping and assembly results. Preprocessing your reads means:
- Removing bases of unwanted sequence (Ex. vectors, adapter, primer sequence, polyA tails).
- Merge/join short overlapping paired-end reads.
- Remove low quality bases or N characters.
- Remove reads originating from PCR duplication.
- Remove reads that are not of primary interest (contamination).
- Remove too short reads.
Preprocessing also produces a number of statistics about the samples. These can be used to evaluate sample-to-sample consistency.
Preprocessing Statistics as QA/QC.
Beyond generating “better” data for downstream analysis, preprocessing statistics also give you an idea as to the original quality and complexity of the sample, library generation features, and sequencing quality.
This can help inform you of how you might change your procedures in the future, either sample preparation, or in library preparation.
We’ve found it best to perform QA/QC on both the run as a whole (poor samples can negatively affect other samples) and on the samples themselves as they compare to other samples (BE CONSISTENT).
Reports such as Basespace for Illumina, are great ways to evaluate the run as a whole, the sequencing provider usually does this for you.
PCA/MDS plots of the preprocessing summary are a great way to look for technical bias across your experiment. Poor quality samples often appear as outliers on the MDS plot and can ethically be removed due to identified technical issues. You should NOT see a trend on the MDS plot associated with any experimental factors. That scenario should raise concerns about technical sample processing bias.
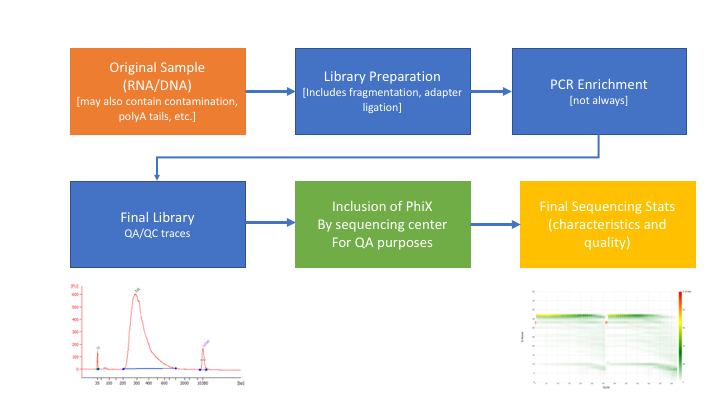
Many technical things happen between original sample and data. Preprocessing is working backwards through that process to get as close as we can to original sample.
In order to better understand and preprocess an RNA-seq data set (and to determine the types of problems we might encounter), it is a good idea to learn what type of library prep kit was used, and how it works.
For this data set, Selimoglu-Buet et al. report the following:
SureSelect Automated Strand Specific RNA Library Preparation Kit was used according to the manufacturer’s instructions with the Bravo Platform. Briefly, 100 ng of total RNA sample was used for poly-A mRNA selection using oligo(dT) beads and subjected to thermal mRNA fragmentation. The fragmented mRNA samples were subjected to cDNA synthesis and were further converted into double-stranded DNA using the reagents supplied in the kit, and the resulting double-stranded DNA was used for library preparation. The final libraries were sequenced on an Hiseq 2000 for human samples and on NovaSeq 6000 for mice samples (Illumina) in paired-end 100 bp mode in order to reach at least 30 millions reads per sample at Gustave Roussy.
Unfortunately the methods don’t provide much information about the strandedness of the library. We can learn more by looking up the user manual. Often times manufacturer web sites and user manuals will contain some hints regarding analysis.
Sequence analysis guidelines
The SureSelect RNA sequencing library preparation method preserves RNA strandedness using dUTP second- strand marking. The sequence of read 1, which starts at the P5 end, matches the reverse complement of the poly- A RNA transcript strand. Read 2, which starts at the P7 end, matches the poly-A RNA transcript strand. When running analysis of this data to determine strandedness, it is important to include this information. For example, when using the Picard tools (https://broadinstitute.github.io/picard) to calculate RNA sequencing metrics, it is important to include the parameter STRAND_SPECIFICITY= SECOND_READ_TRANSCRIPTION_STRAND to correctly calculate the strand specificity metrics.
Agilent has also produced a poster with additional details about the qualities of this library. The figures below provide additional detail about the library and what to expect.
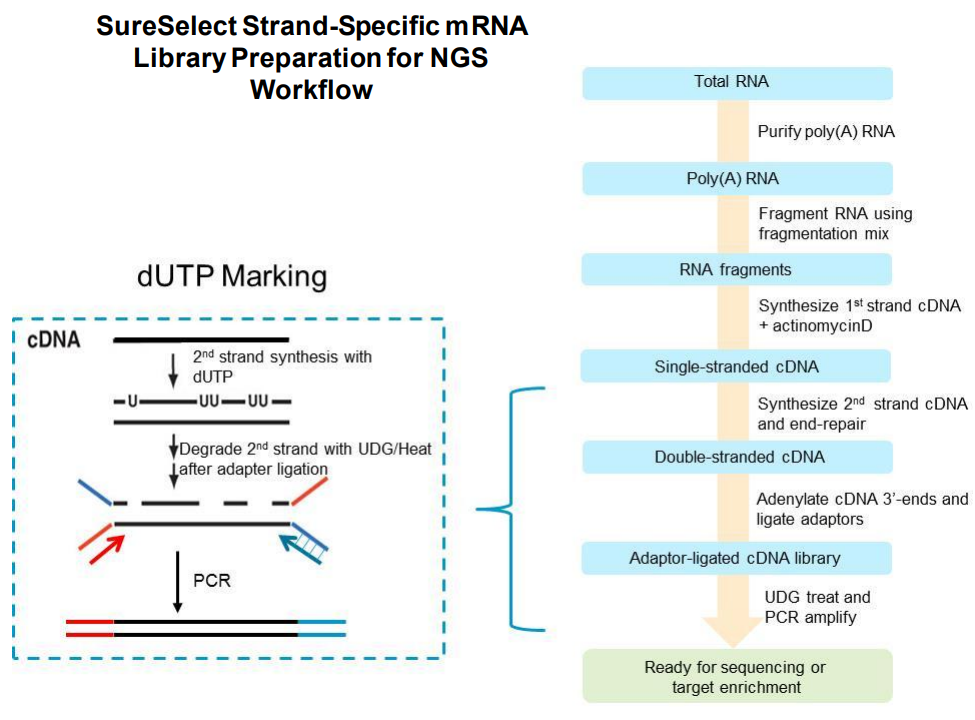

Based on the information above we can conclude that R1 should probably always be in reverse complement orientation with respect to the transcript, and that few reads should have poly-(A/T) signals.
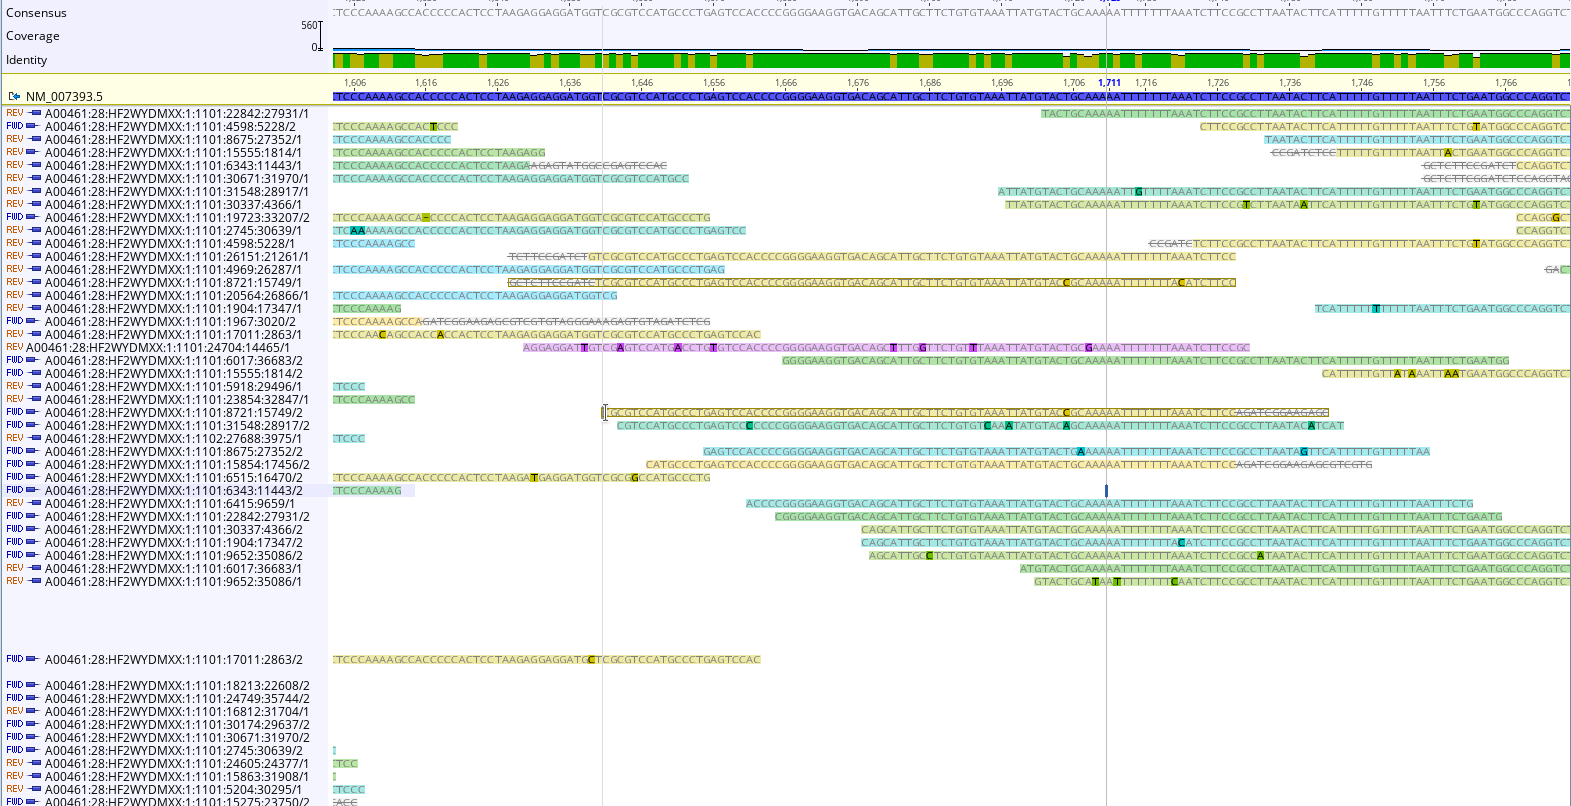
To double check, we could map reads to a “housekeeping gene” like beta actin (NM_007393.5 Mus musculus actin, beta (Actb), mRNA ). Examining the reads can help us confirm our conclusions about the library, and inform decisions about how to clean in.
An RNAseq Preprocessing Workflow
- Remove contaminants (at least PhiX).
- Remove PCR duplicates.
- Count rRNA proportion.
- Join and potentially extend, overlapping paired end reads
- If reads completely overlap they will contain adapter, remove adapters
- Identify and remove any adapter dimers present
- Trim sequences (5’ and 3’) by quality score (I like Q20)
- Run a polyA/T trimmer
- Cleanup
- Remove any reads that are less then the minimum length parameter
- Produce preprocessing statistics
HTStream Streamed Preprocessing of Sequence Data
HTStream is a suite of preprocessing applications for high throughput sequencing data (ex. Illumina). A fast C++ implementation, designed with discreet functionality that can be pipelined together using standard Unix piping.
Benefits Include:
- No intermediate files, reducing storage footprint.
- Reduced I/O, files are only read in and written out once to disk.
- Handles both single end and paired end reads at the same time.
- Applications process reads at the same time allowing for process parallelization.
- Built on top of mature C++ Boost libraries to reduce bugs and memory leaks.
- Designed following the philosophy of Program Design in the UNIX Environment.
- Works with native Unix/Linux applications such as grep/sed/awk etc.
- Can build a custom preprocessing pipeline to fit the specific expectation of the data.
- A single JSON output per sample detailing the preprocessing statistics from each application.
HTStream achieves these benefits by using a tab delimited intermediate format that allows for streaming from application to application. This streaming creates some awesome efficiencies when preprocessing HTS data and makes it fully interoperable with other standard Linux tools.
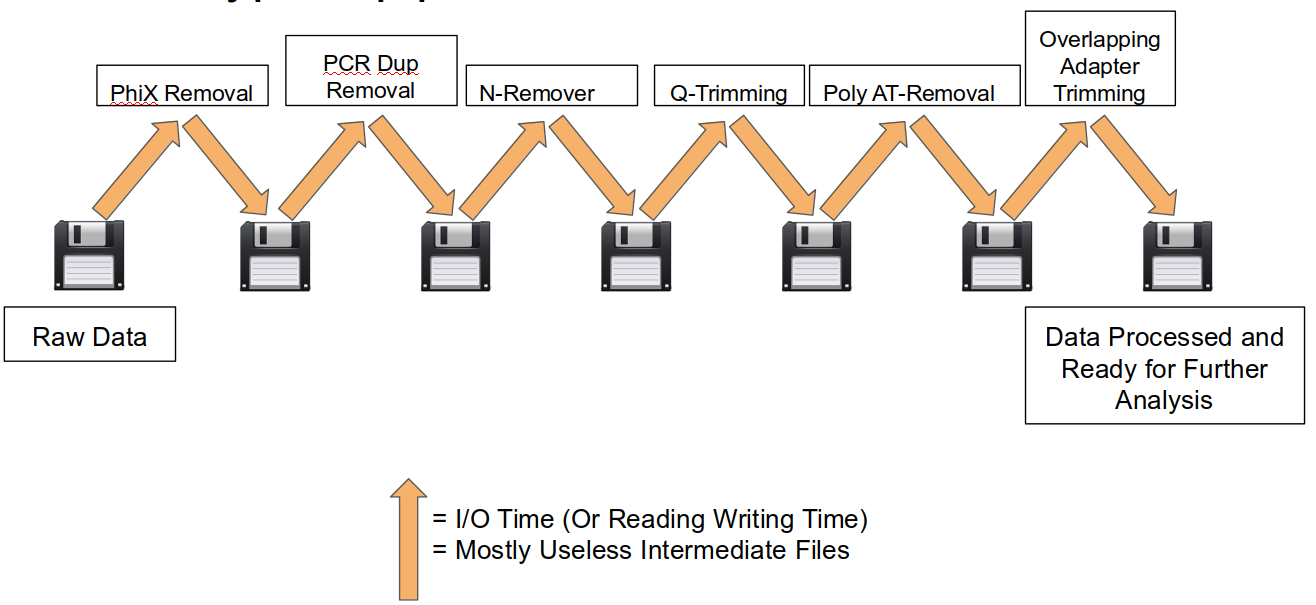
A traditional preprocessing pipeline:
An HTStream preprocessing pipline:
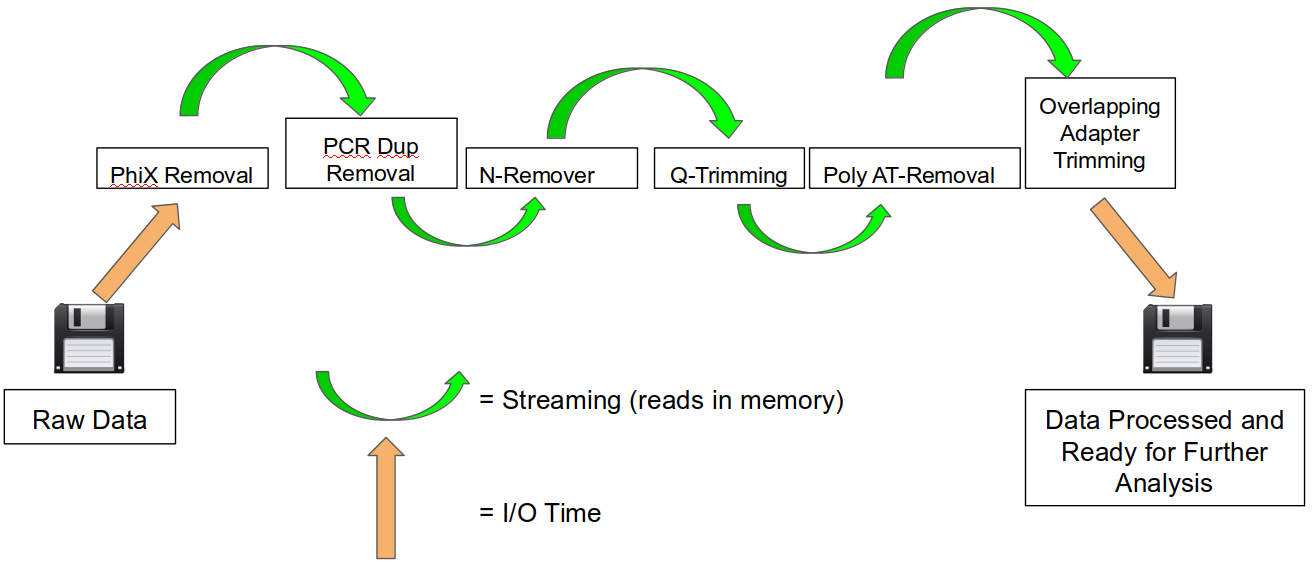
This approach also uses significantly less storage as there are no intermediate files. HTStream can do this by streaming a tab-delimited format called tab6.
Single end reads are 3 columns:
read1id read1seq read1qual
Paired end reads are 6 columns:
read1id read1seq read1qual read2id read2seq read2qual
HTStream applications
HTStream includes the following applications:
hts_AdapterTrimmer: Identify and remove adapter sequences.
hts_CutTrim: Discreet 5’ and/or 3’ basepair trimming.
hts_LengthFilter: Remove reads outside of min and/or max length.
hts_NTrimmer: Extract the longest subsequence with no Ns.
hts_Overlapper: Overlap paired end reads, removing adapters when present.
hts_PolyATTrim: Identify and remove polyA/T sequence.
hts_Primers: Identify and optionally remove 5’ and/or 3’ primer sequence.
hts_QWindowTrim: 5’ and/or 3’ quality score base trimming using windows.
hts_SeqScreener: Identify and remove/keep/count contaminants (default phiX).
hts_Stats: Compute read stats.
hts_SuperDeduper: Identify and remove PCR duplicates.
The source code and pre-compiled binaries for Linux can be downloaded and installed from the GitHub repository.
HTStream is also available on Bioconda, and there is even an image on Docker Hub.
HTStream was designed to be extensible. We continue to add new preprocessing routines and welcome contributions from collaborators.
If you encounter any bugs or have suggestions for improvement, please post them to issues.
HTStream tutorial
Start Group Exercise 1:
Running HTStream
Let’s run the first step of our HTStream preprocessing pipeline, which is always to gather basic stats on the read files. For now, we’re only going to run one sample through the pipeline.
When building a new pipeline, it is almost always a good idea to use a small subset of the data in order to speed up development. A small sample of reads will take seconds to process and help you identify problems that may have only been apparent after hours of waiting for the full data set to process.
-
Let’s start by first taking a small subsample of reads, so that our trial run through the pipeline goes really quickly.
cd /share/workshop/mrnaseq_workshop/$USER/rnaseq_example mkdir HTS_testing cd HTS_testing pwd- Why run
pwdhere?
Then create a small dataset.
 zcat ../00-RawData/mouse_110_WT_C/mouse_110_WT_C.R1.fastq.gz | head -400000 | gzip > mouse_110_WT_C.subset_R1.fastq.gz
 zcat ../00-RawData/mouse_110_WT_C/mouse_110_WT_C.R2.fastq.gz | head -400000 | gzip > mouse_110_WT_C.subset_R2.fastq.gz
 ls -l
So we
zcat(uncompress and send to stdout), pipe|tohead(param -400000) then pipe togzipto recompress and name our files subset.- How many reads are we going to analyze in our subset?
- Why run
-
Now we’ll run our first preprocessing step
hts_Stats, first loading the module and then looking at help.cd /share/workshop/mrnaseq_workshop/$USER/rnaseq_example/HTS_testing module load htstream hts_Stats --help- What version of hts_Stats is loaded?
-
Now lets run
hts_Statsand look at the output.hts_Stats -1 mouse_110_WT_C.subset_R1.fastq.gz \ -2 mouse_110_WT_C.subset_R2.fastq.gz \ -L mouse_110_WT_C.stats.json > out.tab-
What happens if you run hts_Stats without piping output to out.tab?
-
Can you think of a way to view the output from hts_Stats in less without creating out.tab?
By default, all HTS apps output tab formatted files to the stdout.
Take a look at the output (remember
qquits):less out.tabThe output was difficult to understand, lets try without line wrapping (note that you can also type
-Sfrom withinlessif you forget). Scroll with the arrow keys, left, right, up, and down.less -S out.tabAnd delete out.tab since we are done with it:
rm out.tabRemember how this output looks, we will revisit it later.
-
- Now lets change the command slightly.
hts_Stats -1 mouse_110_WT_C.subset_R1.fastq.gz \ -2 mouse_110_WT_C.subset_R2.fastq.gz \ -L mouse_110_WT_C.stats.json -f mouse_110_WT_C.stats- What parameters did we use, what do they do?
Lets take a look at the output of stats
ls -lahtotal 20M drwxrwsr-x 2 shunter mrnaseq_workshop 8 Jul 27 13:44 . drwxrwsr-x 8 shunter mrnaseq_workshop 9 Jul 27 13:37 .. -rw-rw-r-- 1 shunter mrnaseq_workshop 40K Jul 27 13:44 mouse_110_WT_C.stats.json -rw-rw-r-- 1 shunter mrnaseq_workshop 4.7M Jul 27 13:44 mouse_110_WT_C.stats_R1.fastq.gz -rw-rw-r-- 1 shunter mrnaseq_workshop 5.0M Jul 27 13:44 mouse_110_WT_C.stats_R2.fastq.gz -rw-rw-r-- 1 shunter mrnaseq_workshop 4.7M Jul 27 13:39 mouse_110_WT_C.subset_R1.fastq.gz -rw-rw-r-- 1 shunter mrnaseq_workshop 5.0M Jul 27 13:39 mouse_110_WT_C.subset_R2.fastq.gz- Which files were generated from hts_Stats?
- Did stats change any of the data (are the contents of mouse_110_WT_C.stats_R1.fastq.gz identical to mouse_110_WT_C.subset_R1.fastq.gz)?
-
Lets look at the file mouse_110_WT_C.stats.json
less -S mouse_110_WT_C.stats.jsonThe logs generated by htstream are in JSON format, like a database format but meant to be readable.
Next we are going to screen from ribosomal RNA (rRNA).
Ribosomal RNA can make up 90% or more of a typical total RNA sample. Most library prep methods attempt to reduce the rRNA representation in a sample, oligoDt binds to polyA tails to enrich a sample for mRNA, where Ribo-Depletion binds rRNA sequences to biotinylated oligo probes that are captured with streptavidin-coated magnetic beads to deplete the sample of rRNA. Newer methods use targeted probes to facilitate degradation of specific sequences (e.g. Tecan/Nugen AnyDeplete, DASH, etc). No technique is 100% efficient all of the time, and some can fail spectacularly, so knowing the relative proportion of rRNA in each sample can be helpful.
Before we do so we need to find sequences of ribosomal RNA to screen against.
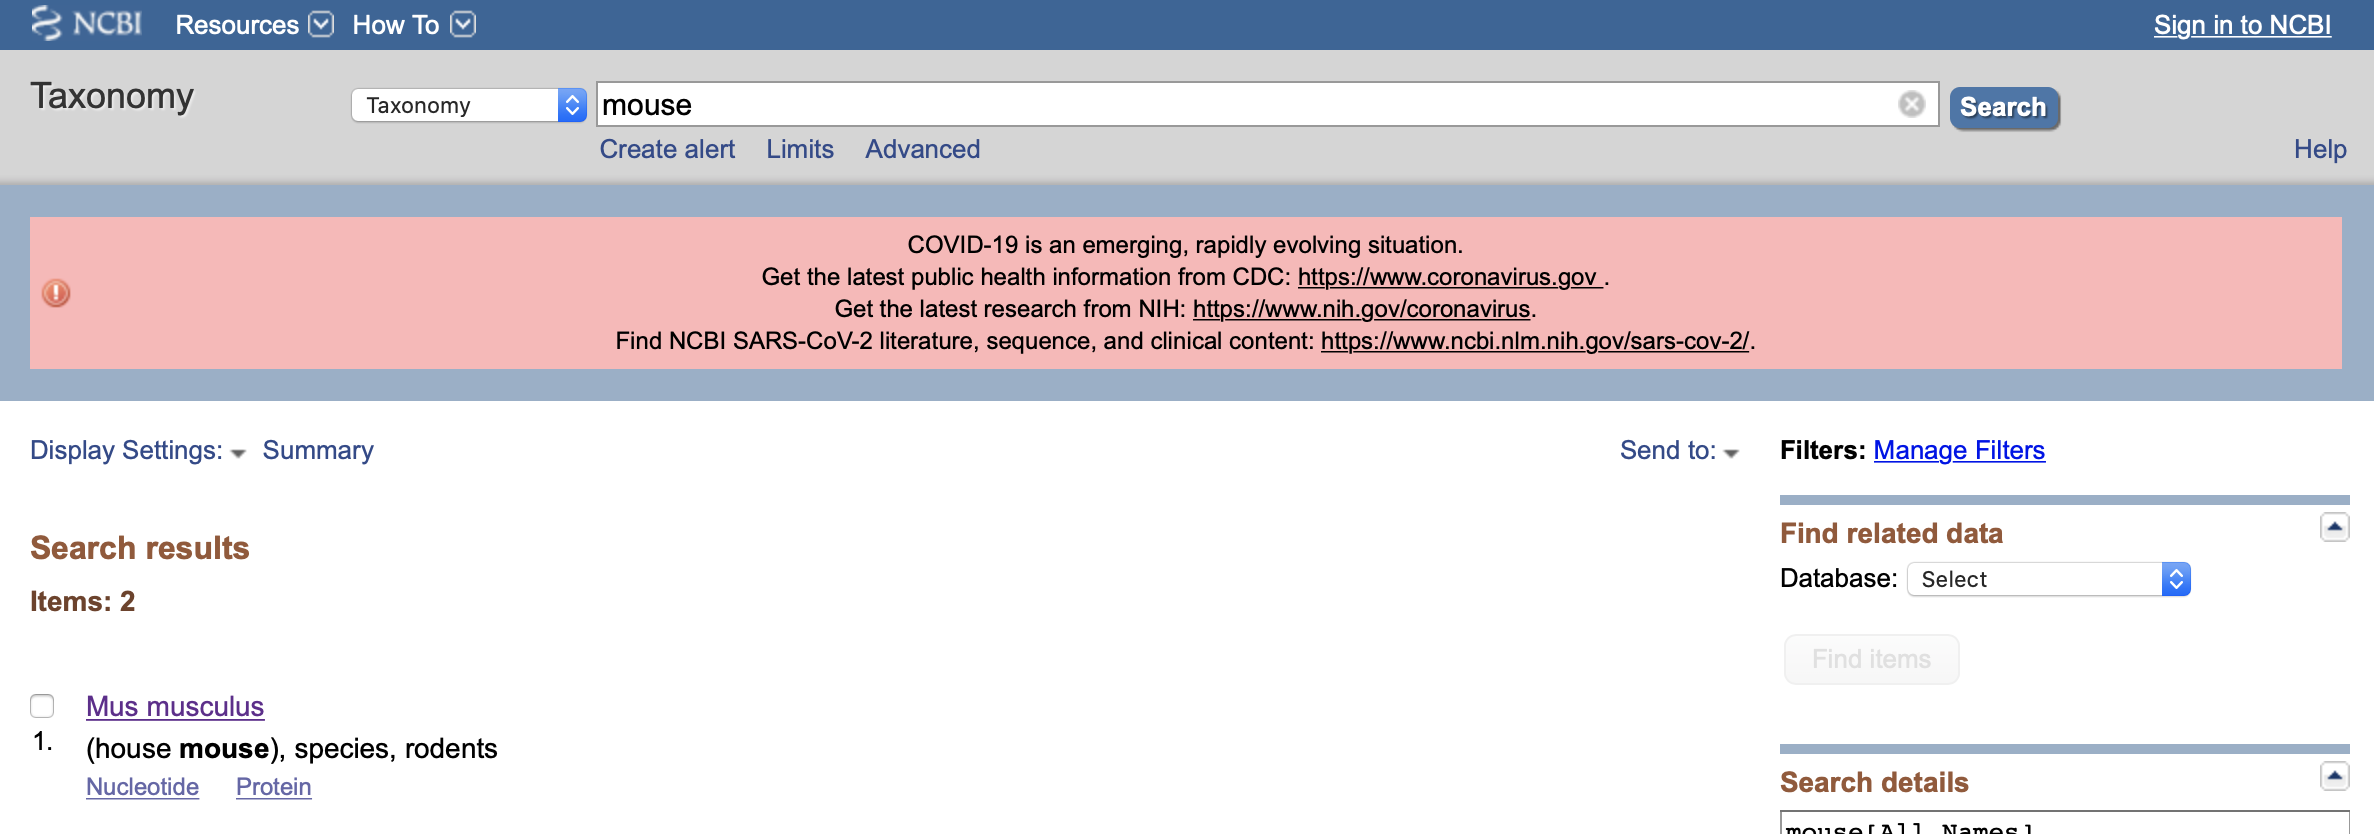
We will use these sequences to identify rRNA in our reads, which are from mouse. One way to do that is to go to NCBI and search for them.
-
First, go to NCBI and in the Search drop down select “Taxonomy” and search for “mouse”.

-
Click on “Mus musculus”.
-
Click on “Mus musculus” again.
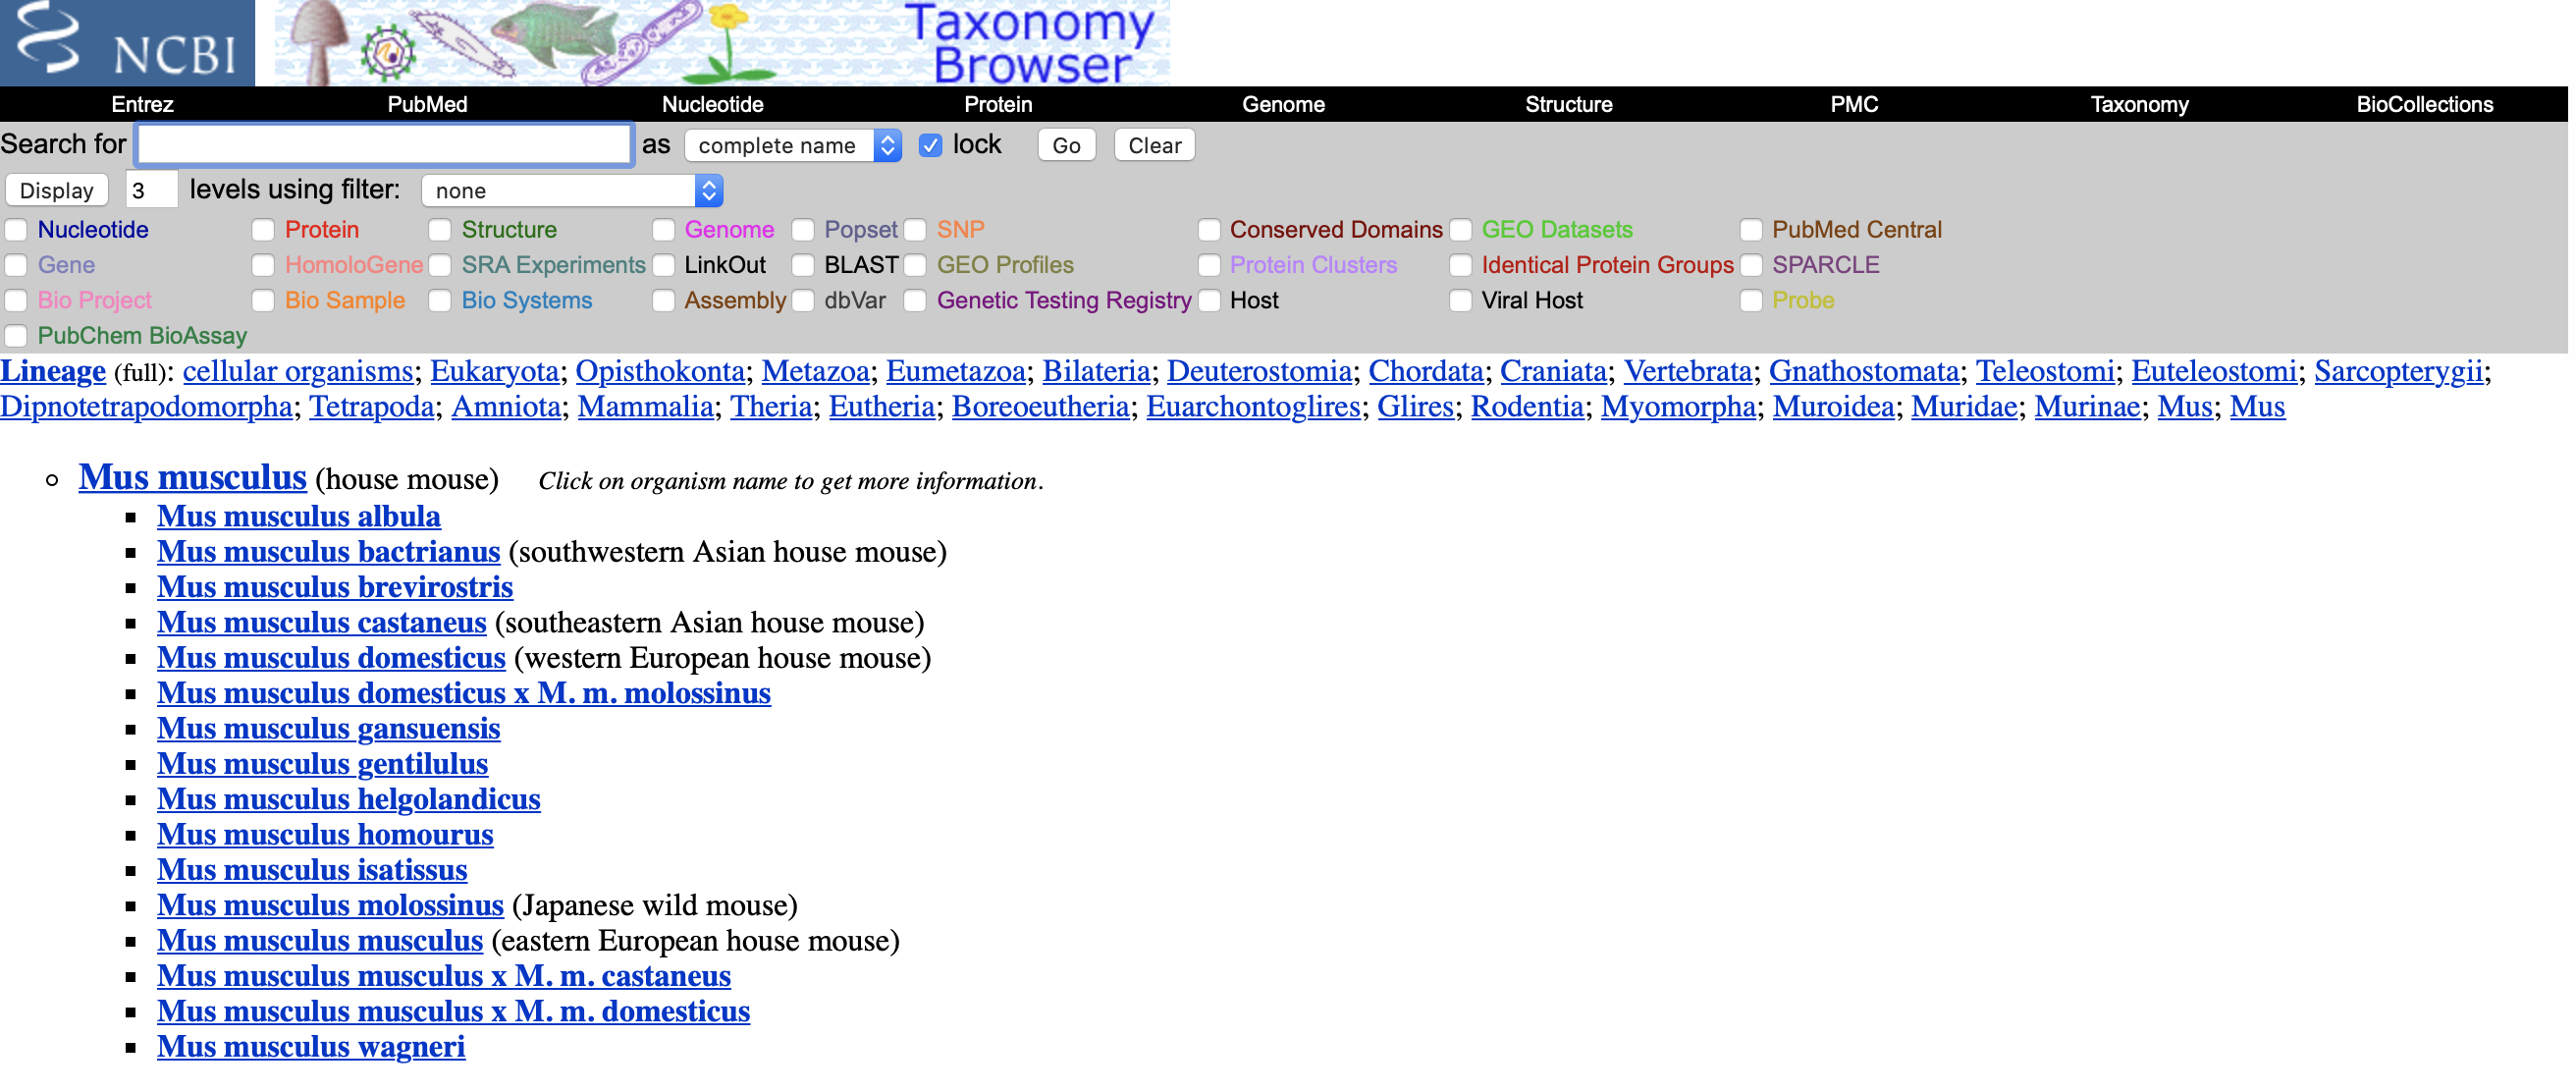
-
Click on the “Subtree links” for Nucleotide.
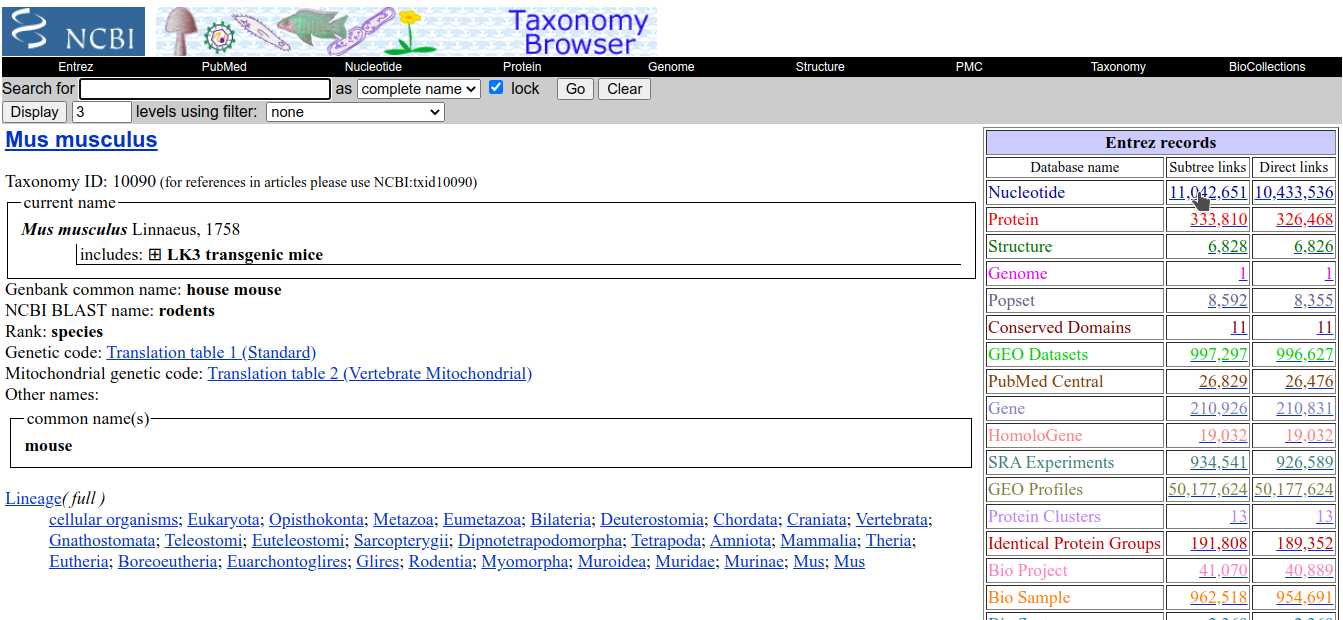
-
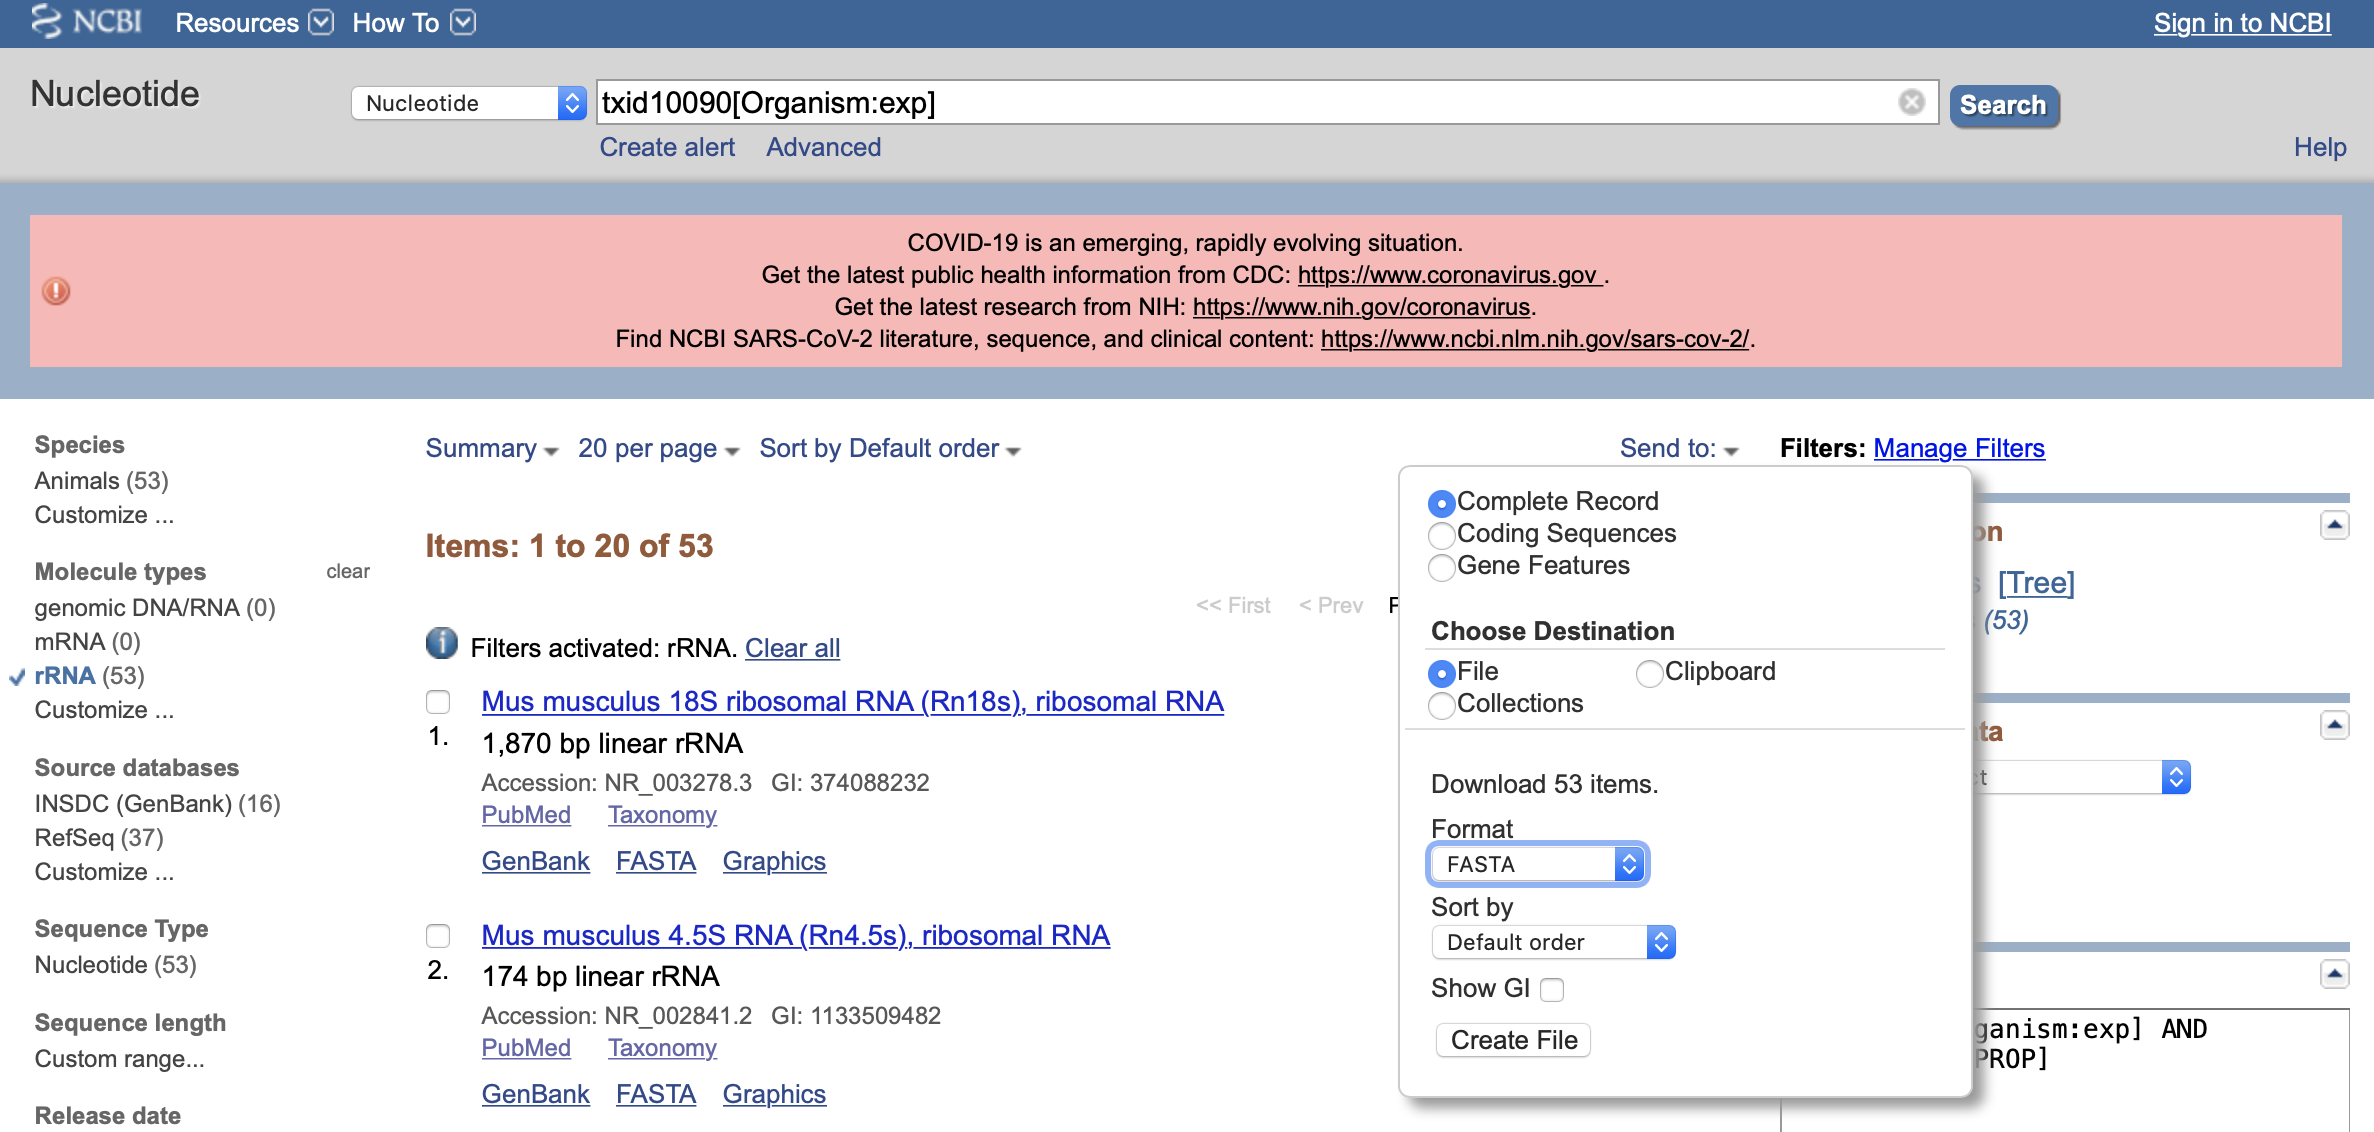
Under Molecule Types, click on “rRNA” (left hand side).
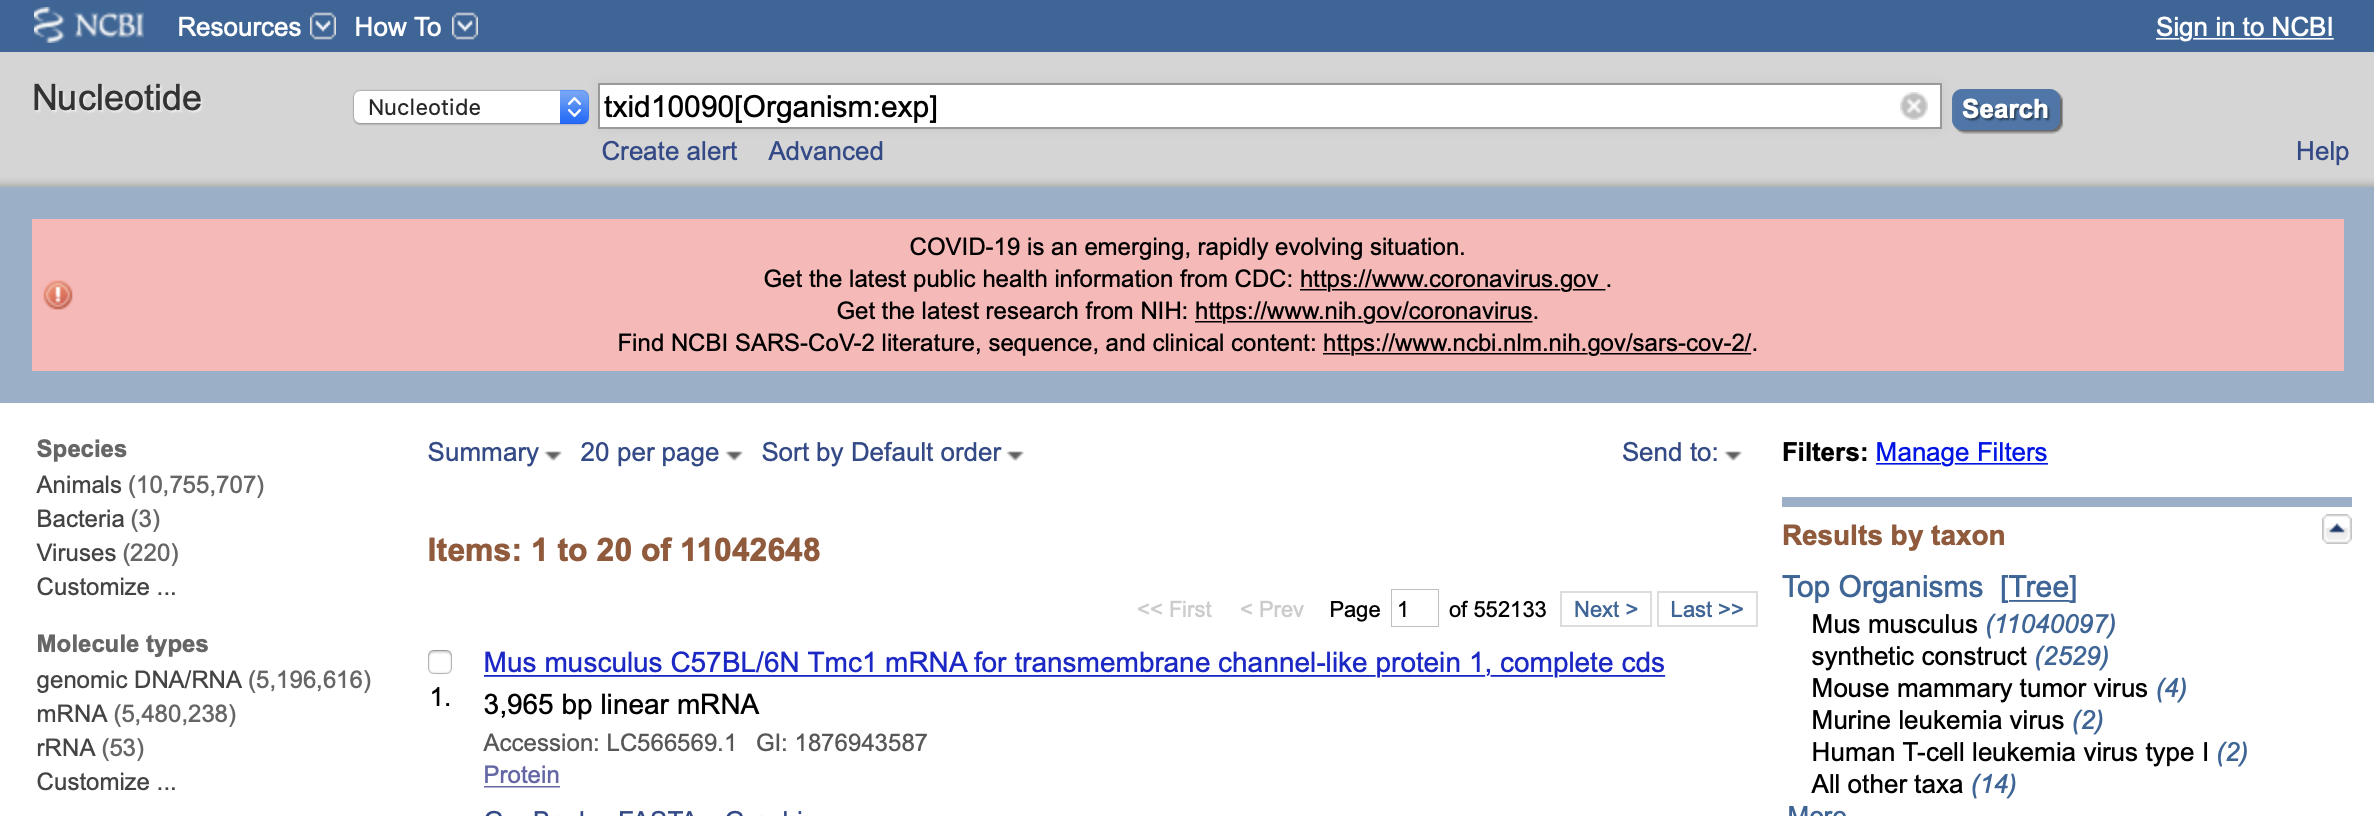
-
Click on “Send”, choose “File”, choose Format “FASTA”, and click on “Create File”.
Save this file to your computer, and rename it to ‘mouse_rrna.fasta’.
Upload your mouse_rrna.fasta file to the ‘References’ directory in your project folder using either scp or FileZilla (or equivalent).
Or if you feel like ‘cheating’, just copy/paste the contents of mouse_rrna.fa using nano into a file named /share/workshop/mrnaseq_workshop/$USER/rnaseq_example/References/mouse_rrna.fasta
nano /share/workshop/mrnaseq_workshop/$USER/rnaseq_example/References/mouse_rrna.fasta
Paste contents of mouse_rrna.fa and save
This is really cheating, but if all else fails, download the file as follows:
cd /share/workshop/mrnaseq_workshop/$USER/rnaseq_example/References
wget https://github.com/ucdavis-bioinformatics-training/2020-mRNA_Seq_Workshop/raw/master/data_reduction/mouse_rrna.fasta
Using HTStream to count ribosomal rna (not remove, but just to count the occurrences).
-
First, view the help documentation for hts_SeqScreener
cd /share/workshop/mrnaseq_workshop/$USER/rnaseq_example/HTS_testing hts_SeqScreener -h- What parameters are needed to:
- provide a reference to hts_SeqScreener and
- count but not screen occurrences?
- What parameters are needed to:
-
Run HTStream on the small test set.
hts_SeqScreener -1 mouse_110_WT_C.subset_R1.fastq.gz \ -2 mouse_110_WT_C.subset_R2.fastq.gz \ -s ../References/mouse_rrna.fasta -r -L mouse_110_WT_C.rrna.json -f mouse_110_WT_C.rrna-
Which files were generated from hts_SeqScreener?
-
Take look at the file mouse_110_WT_C.rrna.json
-
How many reads were identified as rRNA?
-
What fraction of reads were identified as rRNA, do you think cleanup worked well for this sample?
-
Getting more advanced: Streaming multiple applications together
-
Lets try it out. First run hts_Stats and then hts_SeqScreener in a streamed fashion.
 cd /share/workshop/mrnaseq_workshop/$USER/rnaseq_example/HTS_testing

 hts_Stats -1 mouse_110_WT_C.subset_R1.fastq.gz \
           -2 mouse_110_WT_C.subset_R2.fastq.gz \
           -L mouse_110_WT_C.streamed.json |
 hts_SeqScreener -A mouse_110_WT_C.streamed.json \
           -r -s ../References/mouse_rrna.fasta -f mouse_110_WT_C.streamed
Note the pipe,
|, between the two applications!Questions
-
What new parameters did we use here?
-
What parameter is SeqScreener using that specifies how reads are input?
-
Look at the file mouse_110_WT_C.streamed.json
-
Can you find the section for each program?
-
Were the programs run in the order you expected?
-
-
hts_SeqScreener will screen out PhiX reads by default. Try to modify the pipeline as follows:
-
hts_Stats –> hts_SeqScreener discard PhiX –> hts_SeqScreener count rRNA and output
-
*Check the JSON file that is produced. Were any PhiX reads identified?
-
-
*Try to figure out how to use hts_Stats in combination with grep to search for reads that contain the sequence “CCGTCTTCTGCTTG”. How many were there? Do you notice anything strange about them?
-
Stop Group Exercise 1
A RNAseq preprocessing pipeline
- hts_Stats: get stats on input raw reads
- hts_SeqScreener: screen out (remove) phiX
- hts_SeqScreener: screen for (count) rRNA
- hts_SuperDeduper: identify and remove PCR duplicates
- hts_AdapterTrimmer: identify and remove adapter sequence
- hts_PolyATTrim: remove polyA/T from the end of reads.
- hts_NTrimmer: trim to remove any remaining N characters
- hts_QWindowTrim: remove poor quality bases
- hts_LengthFilter: use to remove all reads < 50bp
- hts_Stats: get stats on output cleaned reads
Why screen for phiX?
PhiX Control v3 is a common control in Illumina runs, and facilities may not tell you if/when PhiX has been spiked in. Since it does not have a barcode, in theory should not be in your data.
However:
- When we know PhiX has been spiked in, we find sequence every time.
- [update] When dual matched barcodes are used, then almost zero phiX reads can be identified.
- When we know that PhiX has not been spiked in, we rarely find matching sequence.
For RNAseq and variant analysis (any mapping based technique) it is not critical to remove, but for sequence assembly it is (and will often assemble into a full-length PhiX genome). Unless you are sequencing PhiX, it is noise, so its better safe than sorry to screen for it every time.
Removing PCR duplicates with hts_SuperDeduper.
Removing PCR duplicates can be controversial for RNAseq, but there is some argument in favor of it for paired-end data. In particular, duplication rate tells you a lot about the original complexity of each sample and potential impact of sequencing depth.
**However, it would never be a good idea to do PCR duplicate removal on Single-End reads!**
Many other read de-duplication algorithms rely on mapping position to identify duplicated reads (although some other reference free methods do exist https://doi.org/10.1186/s12859-016-1192-5). Reads that are mapped to the same position on the genome probably represent the same original fragment sequenced multiple times as PCR duplicates (think “technical replicates”).
However, this approach requires that there be a reference to map reads against and requires that someone maps the reads first!
hts_SuperDeduper does not require a reference or mapped reads. Instead it uses a small portion of each paired read to identify duplicates. If an identical pattern is identified in multiple reads, extra copies are discarded.
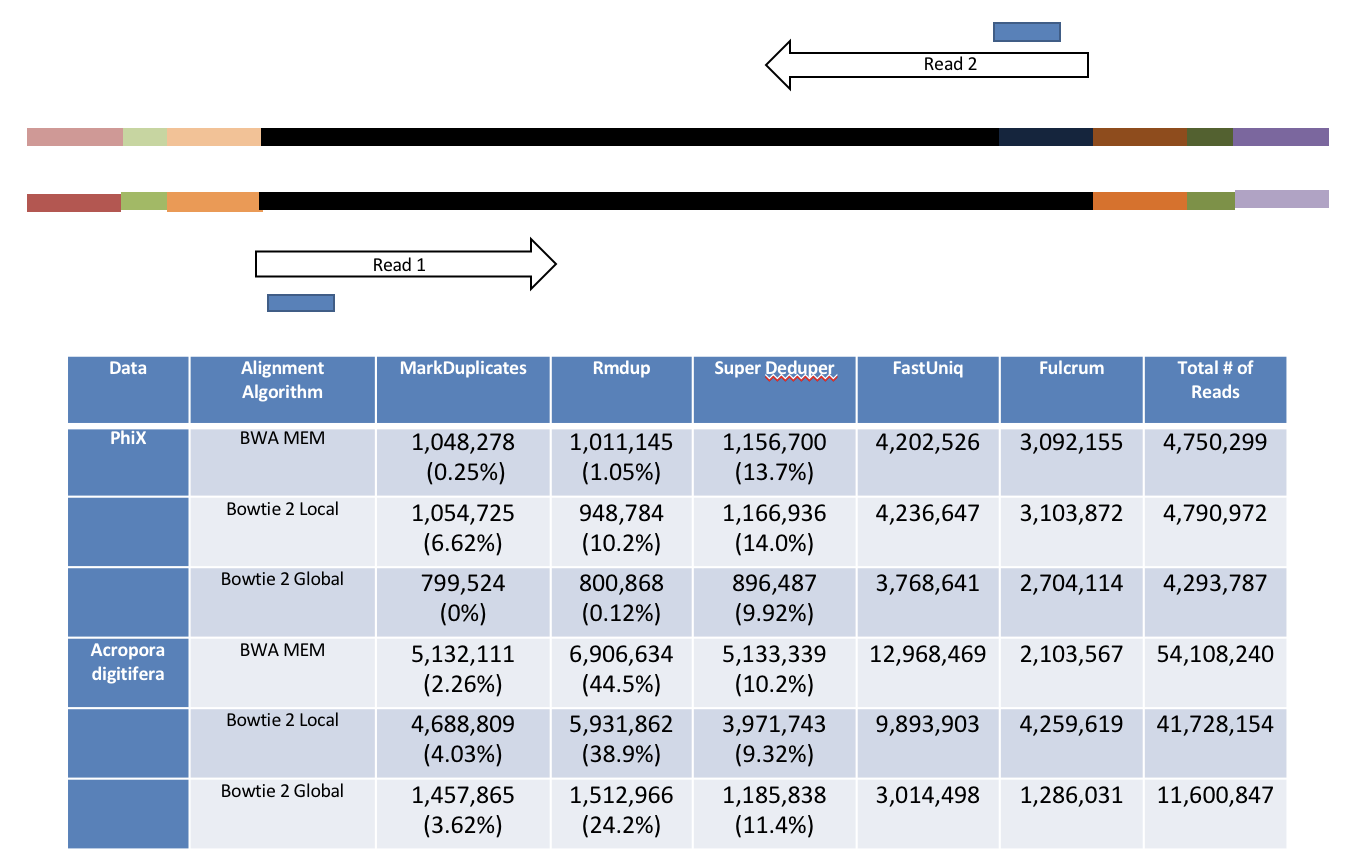
This table compares the performance of SuperDeduper against some other duplicate removal algorithms. Two data sets were tested, PhiX spike in reads and reads from Acropora digitifera (a type of coral). The number of unique reads identified is listed along with the percentage of duplicates not reported by other tools in parentheses. SuperDeduper performance is similar to other mapping based deduplication tools (MarkDuplicates and Rmdup), however it identifies slightly more unique reads (in some cases these were unmapped reads, in other cases reads with sequencing errors in the key region). FastUniq and Fulcrum are two other tools that do not rely on mapping. They identified a much larger set of reads as being unique.
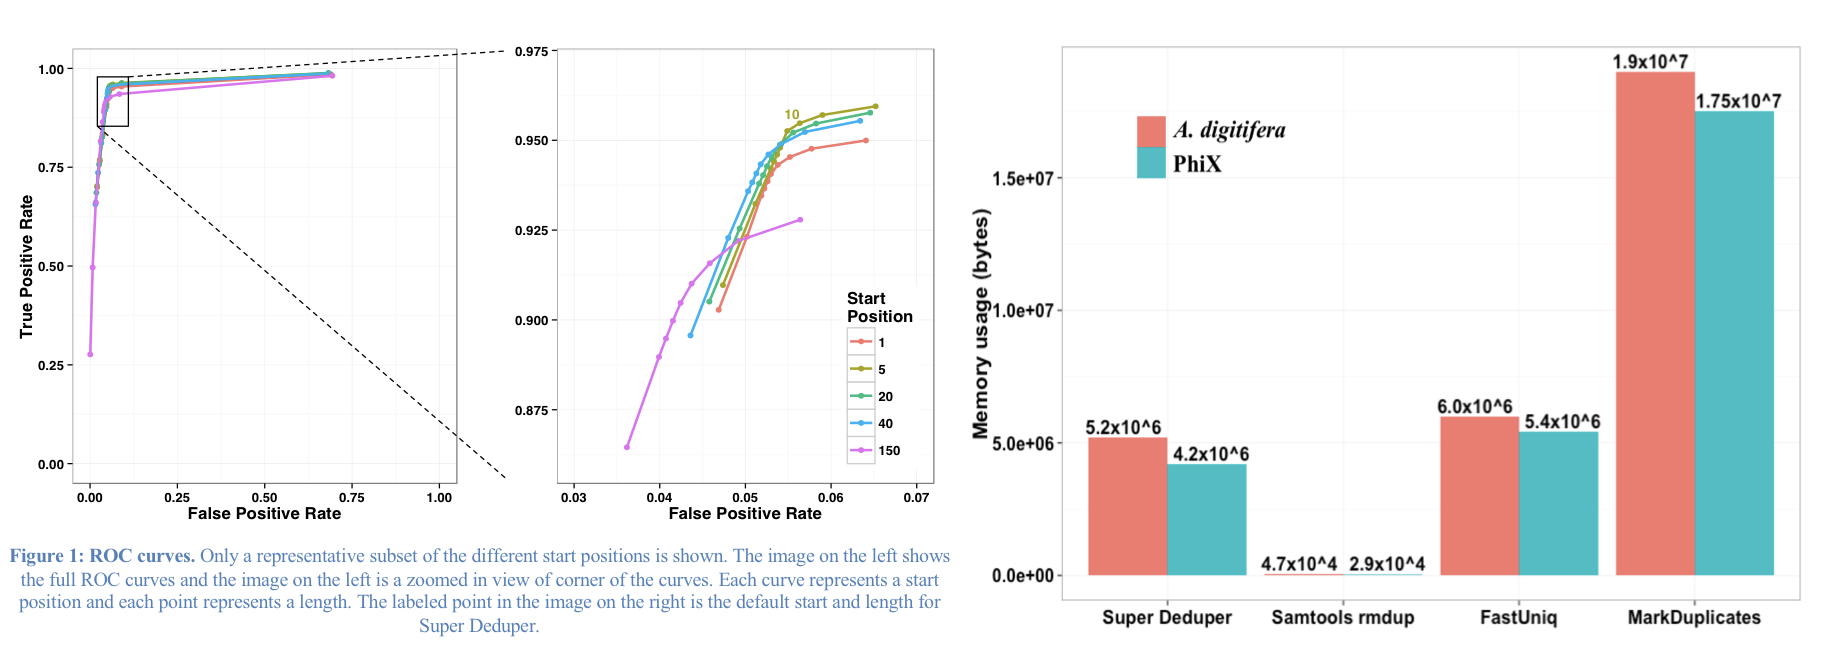
We calculated the Youden Index for every combination tested (using results from Picard MarkDuplicates as ground truth). The point that acquired the highest index value occurred at a start position of 5 and a length of 10bp (20bp total over both reads). However in order to avoid the often lower-quality region in the first ~10bp of Illumina Read1, hts_SuperDeduper uses a default start position of basepair 10 and a length of 10bp.
Adapter trimming by overlapping reads.
Consider the three scenarios below
Insert size > length of the number of cycles
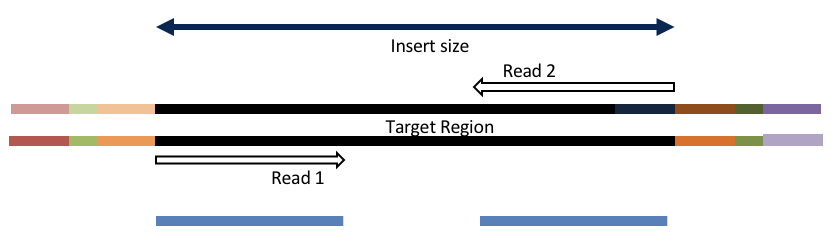
hts_AdapterTrimmer product: original pairs
hts_Overlapper product: original pairs
Insert size < length of the number of cycles (10bp min)
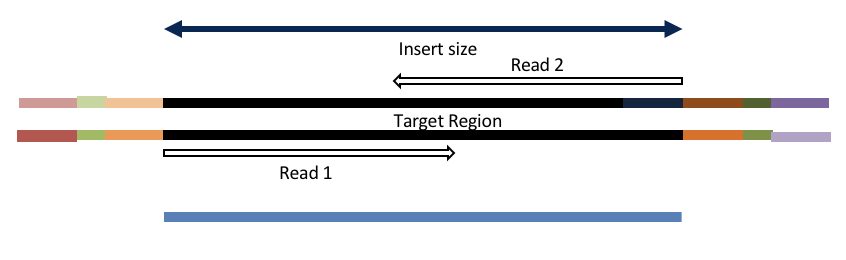
hts_AdapterTrimmer product: original pairs
hts_Overlapper product: extended, single
Insert size < length of the read length
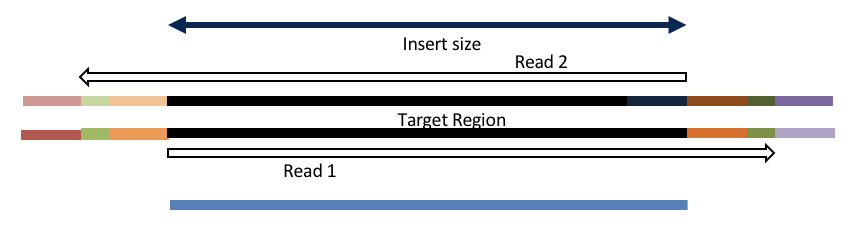
hts_AdapterTrimmer product: adapter trimmed, pairs
hts_Overlapper product: adapter trimmed, single
Both hts_AdapterTrimmer and hts_Overlapper employ this principle to identify and remove adapters for paired-end reads. For paired-end reads the difference between the two are the output, as overlapper produces single-end reads when the pairs overlap and adapter trimmer keeps the paired end format. For single-end reads, adapter trimmer identifies and removes adapters by looking for the adapter sequence, where overlapper just ignores single-end reads (nothing to overlap).
You can do a quick check for evidence of Illumina sequencing adapters using basic Linux commnads
Remember that Illumina reads must have P5 and P7 adapters and generally look like this (in R1 orientation):
P5---Index-Read1primer-------INSERT-------Read2primer--index--P7(rc)
                     |---R1 starts here-->
This sequence is P7(rc): ATCTCGTATGCCGTCTTCTGCTTG. It should present in any R1 that contains a full-length adapter sequence. It is easy to search for this sequence using zcat and grep:
cd /share/workshop/mrnaseq_workshop/$USER/rnaseq_example/HTS_testing
zcat mouse_110_WT_C.subset_R1.fastq.gz | grep TCTCGTATGCCGTCTTCTGCTTG
PloyATTrimming hts_PolyATTrim: remove polyA/T from the end of reads.
In eukaryotes, mRNA maturation includes a polyadenylation step in which a poly(A) tail is added to the transcript. These bases (and the complementary poly(T) in some types of libraries) do not actually exist in the genome and are commonly trimmed in RNA-seq preprocessing pipelines.
N Trimming
Bases that cannot be called are assigned an “N” by the Illumina base caller. These can be a problem for some applications, but most read mappers and quantification strategies should not be impacted unless N’s are frequent. By default, hts_NTrimmer will return the longest sequence that contains no Ns, but can also be configured to discard any reads containing Ns as well.
Q-window trimming.
As a sequencing run progresses the quality scores tend to get worse. Quality scores are essentially a guess about the accuracy of a base call, so it is common to trim of the worst quality bases.
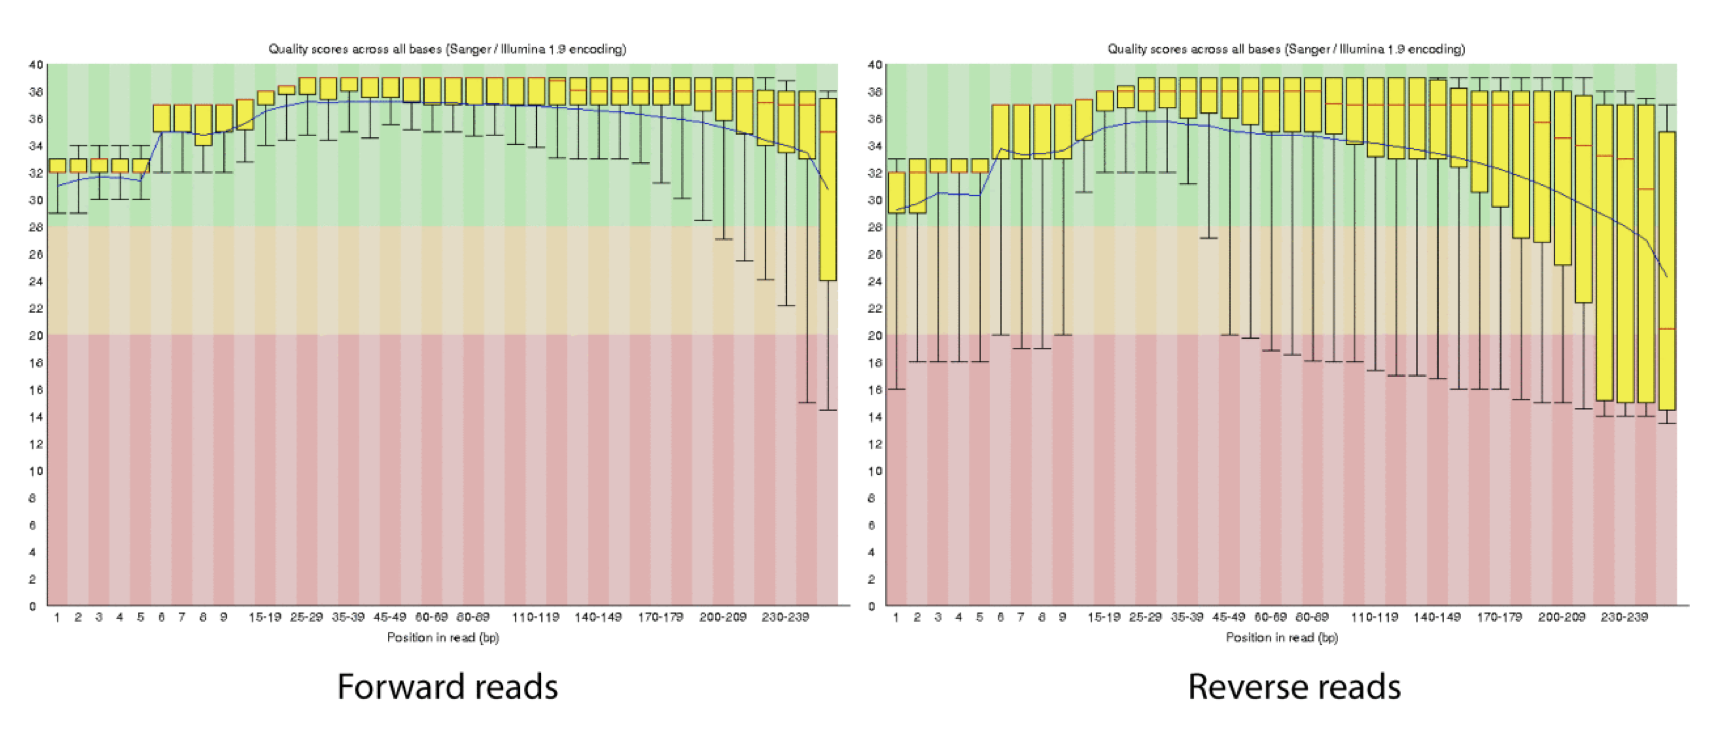
This is how reads commonly look, they start at “good” quality, increase to “excellent” and degrade to “poor”, with R2 always looking worse (except when they don’t) than R1 and get worse as the number of cycles increases.
hts_QWindowTrim trims 5’ and/or 3’ end of the sequence using a windowing (average quality in window) approach.
What does all this preprocessing get you
Comparing Salmon quant, raw vs preprocessed reads
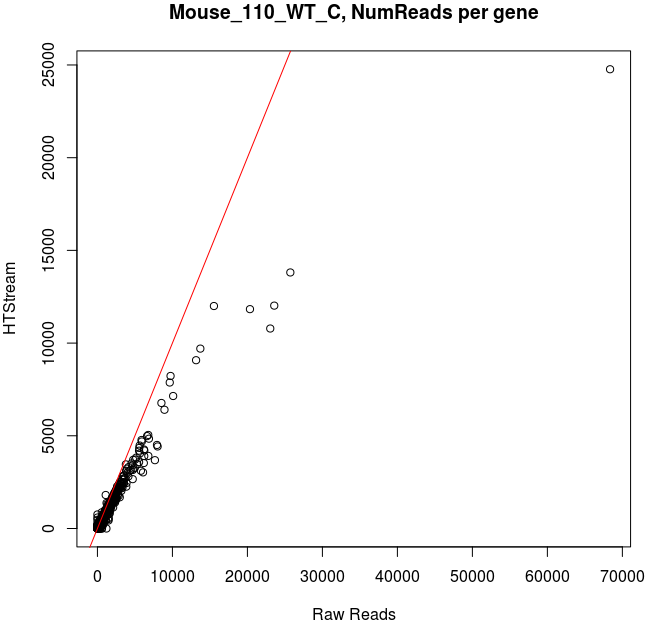
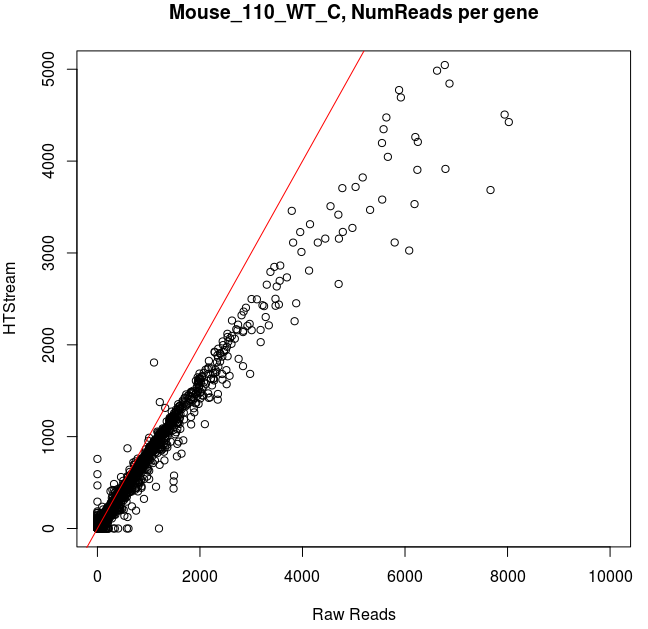
Note that the very highly expressed transcript is Lysozyme 2, ENSMUST00000092163.8, a primarily bacteriolytic enzyme. Not surprising given that “monocytes are components of the mononuclear phagocyte system that is involved in rapid recognition and clearance of invading pathogens”.
- The majority of transcripts have similar reads per gene before/after cleanup.
- Some low expression transcripts had zero reads before cleanup, but hundreds after cleanup (and vice versa).
- A large number of genes have higher total reads mapped before cleaning.
Lets put it all together
Start Group Exercise 2
cd /share/workshop/mrnaseq_workshop/$USER/rnaseq_example/HTS_testing

hts_Stats -L mouse_110_WT_C_htsStats.json -N "initial stats" \
    -1 mouse_110_WT_C.subset_R1.fastq.gz \
    -2 mouse_110_WT_C.subset_R2.fastq.gz | \
hts_SeqScreener -A mouse_110_WT_C_htsStats.json -N "screen phix" | \
hts_SeqScreener -A mouse_110_WT_C_htsStats.json -N "count the number of rRNA reads"\
     -r -s ../References/mouse_rrna.fasta | \
hts_SuperDeduper -A mouse_110_WT_C_htsStats.json -N "remove PCR duplicates" | \
hts_AdapterTrimmer -A mouse_110_WT_C_htsStats.json -N "trim adapters" | \
hts_PolyATTrim  -A mouse_110_WT_C_htsStats.json -N "trim adapters" | \
hts_NTrimmer -A mouse_110_WT_C_htsStats.json -N "remove any remaining 'N' characters" | \
hts_QWindowTrim -A mouse_110_WT_C_htsStats.json -N "quality trim the ends of reads" | \
hts_LengthFilter -A mouse_110_WT_C_htsStats.json -N "remove reads < 50bp" \
    -n -m 50 | \
hts_Stats -A mouse_110_WT_C_htsStats.json -N "final stats" \
    -f mouse_110_WT_C.htstream
Note the patterns:
- In the first routine we use -1 and -2 to specify the original reads.
- In the final routine -f fastq prefix to write out new preprocessed reads.
- For the log, we specify -L in the first app to write out to a new log, and then use -A for the second routine onward to append log output, generating a single log file at the end.
- All other parameters are algorithm specific, can review using –help
Questions
-
Review the final json output, how many reads do we have left?
-
Confirm that number by counting the number of reads in the final output files.
-
How many reads had adapters that were cut off?
-
How many PCR duplicates were there?
-
Anything else interesting?
Run HTStream on the Project.
We can now run the preprocessing routine across all samples on the real data using a SLURM script, hts_preproc.slurm, that we should take a look at now.
cd /share/workshop/mrnaseq_workshop/$USER/rnaseq_example  # We'll run this from the main directory
wget https://ucdavis-bioinformatics-training.github.io/2022-June-RNA-Seq-Analysis/software_scripts/scripts/hts_preproc.slurm
less hts_preproc.slurm
When you are done, type “q” to exit.
Double check to make sure that slurmout and 01-HTS_Preproc directories have been created for output, then after looking at the script, let’s run it.
cd /share/workshop/mrnaseq_workshop/$USER/rnaseq_example
mkdir -p slurmout  # -p tells mkdir not to complain if the directory already exists
mkdir -p 01-HTS_Preproc
sbatch hts_preproc.slurm  # moment of truth!
We can watch the progress of our task array using the ‘squeue’ command. Takes about 30 minutes to process each sample.
squeue -u $USER # use your username
End Group Exercise 2
Quality Assurance - Preprocessing statistics as QA/QC.
Beyond generating “better” data for downstream analysis, cleaning statistics also give you an idea as to the original quality and complexity of the sample, library generation, and sequencing quality.
The first step in this process is to talk with your sequencing provider to ask about run level quality metrics. The major sequencing platforms all provide quality metrics that can provide insight into whether things might have gone wrong during library preparation or sequencing. Sequencing providers often generate reports and provide them along with the sequencing data.
BaseSpace Plots for Illumina data
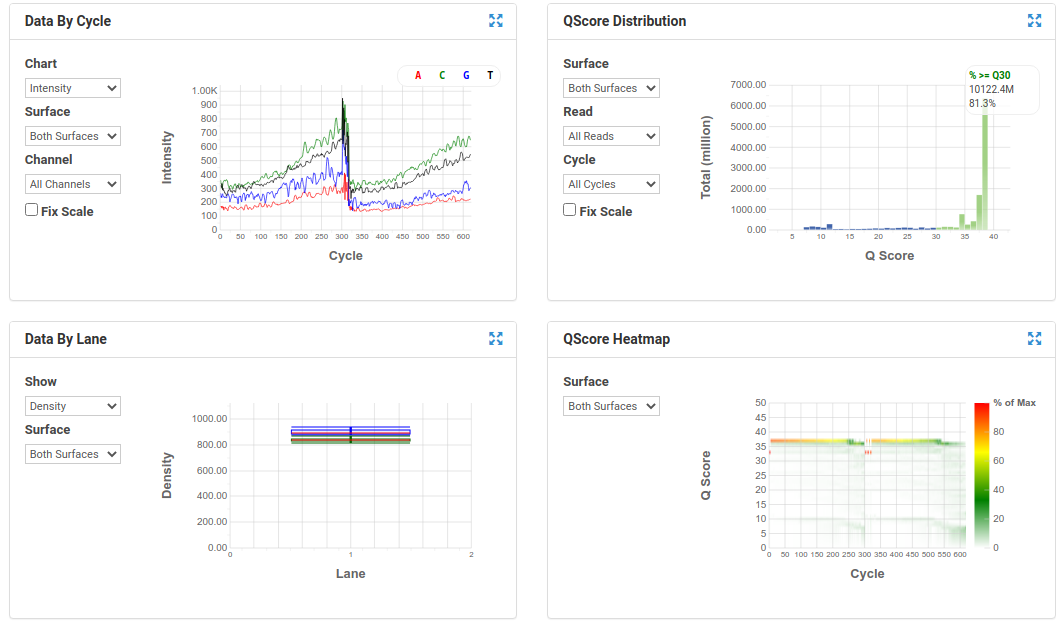
A nice run showing fairly random distribution of bases per cycle, > 80% bases above Q30, good cluster density and high pass filter rate, and very little drop off in read quality even at the end of the read.
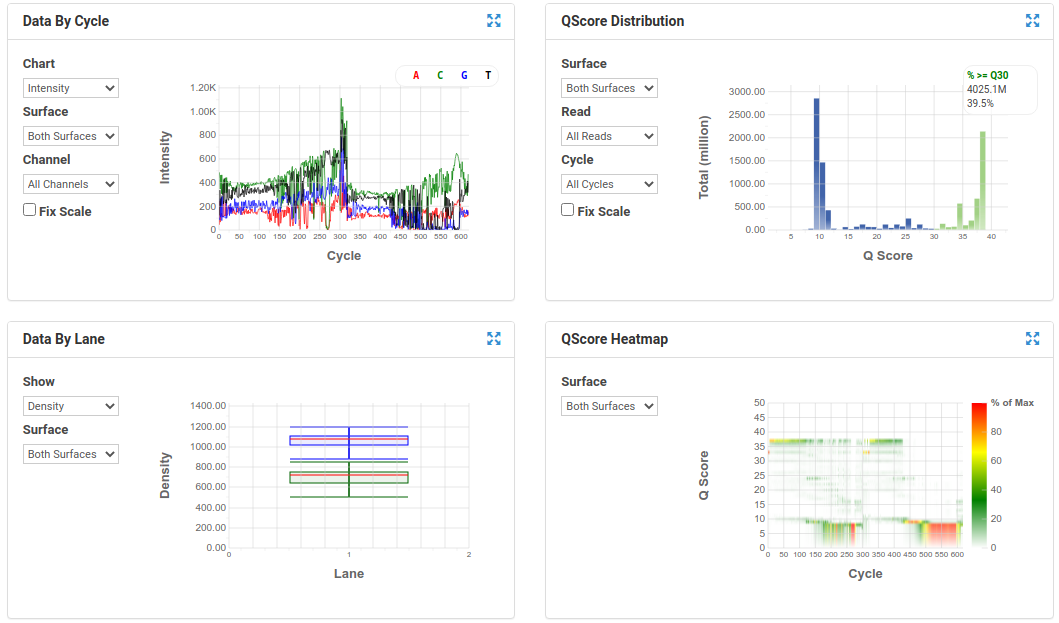 A poor run showing less base diversity, only 39% bases above Q30, potentially too high cluster density and low pass filter rate, and extreme drop off in read quality after ~100bp of R1, and an even worse profile in R2.
Results like those above can help inform you of how you might change your protocol/procedures in the future, either sample preparation (RNA extraction), or in library preparation.
The next step is to consider quality metrics for each sample. The key consideration is that (SAMPLES SHOULD BE CONSISTENT!). Plots of the preprocessing summary statistics are a great way to look for technical bias and batch effects within your experiment. Poor quality samples often appear as outliers and can ethically be removed due to identified technical issues.
The JSON files output by HTStream provide this type of information.
Begin Group Exercise 3
-
Let’s make sure that all jobs completed successfully.
First check all the “htstream_*.out” and “htstream_*.err” files:
 cd /share/workshop/mrnaseq_workshop/$USER/rnaseq_example
 cat slurmout/htstream_*.out
Look through the output and make sure you don’t see any errors. Now do the same for the err files:
cat slurmout/htstream_*.errAlso, check the output files. First check the number of forward and reverse output files (should be 22 each):
 cd 01-HTS_Preproc
 ls */*R1* | wc -l
 ls */*R2* | wc -l
Did you get the answer you expected, why or why not?
Check the sizes of the files as well. Make sure there are no zero or near-zero size files and also make sure that the size of the files are in the same ballpark as each other:
 ls -lh *

 du -sh *
All of the samples started with the same number of reads. What can you tell from the file sizes about how cleaning went across the samples?
IF for some reason HTStream didn’t finish, the files are corrupted or you missed the session, please let one of us know and we will help. You can also copy over the HTStream output.
cp -r /share/biocore/workshops/2020_mRNAseq_July/01-HTS_Preproc /share/workshop/mrnaseq_workshop/$USER/rnaseq_example/. -
Let’s take a look at the differences in adapter content between the input and output files. First look at the input file:
 cd /share/workshop/mrnaseq_workshop/$USER/rnaseq_example
 zless 00-RawData/mouse_110_WT_C/mouse_110_WT_C.R1.fastq.gz
Let’s search for the adapter sequence. Type ‘/’ (a forward slash), and then type AGATCGGAAGAGCACACGTCTGAACTCCAGTCAC (the first part of the forward adapter). Press Enter. This will search for the sequence in the file and highlight each time it is found. You can now type “n” to cycle through the places where it is found. When you are done, type “q” to exit.
Now look at the output file:
zless 01-HTS_Preproc/mouse_110_WT_C/mouse_110_WT_C_R1.fastq.gzIf you scroll through the data (using the spacebar), you will see that some of the sequences have been trimmed. Now, try searching for AGATCGGAAGAGCACACGTCTGAACTCCAGTCAC again. You shouldn’t find it (adapters were trimmed remember), but rarely is anything perfect. You may need to use Control-C to get out of the search and then “q” to exit the ‘less’ screen.
Lets grep for the sequence and get an idea of where it occurs in the raw sequences:
zcat 00-RawData/mouse_110_WT_C/mouse_110_WT_C.R1.fastq.gz | grep --color=auto AGATCGGAAGAGCACACGTCTGAACTCCAGTCAC- What do you observe? Are these sequences useful for analysis?
zcat 01-HTS_Preproc/mouse_110_WT_C/mouse_110_WT_C_R1.fastq.gz | grep --color=auto AGATCGGAAGAGCACACGTCTGAACTCCAGTCACLets grep for the sequence and count occurrences
zcat 00-RawData/mouse_110_WT_C/mouse_110_WT_C.R1.fastq.gz | grep AGATCGGAAGAGCACACGTCTGAACTCCAGTCAC | wc -l zcat 01-HTS_Preproc/mouse_110_WT_C/mouse_110_WT_C_R1.fastq.gz | grep AGATCGGAAGAGCACACGTCTGAACTCCAGTCAC | wc -l-
What is the reduction in adapters found?
-
How could you modify the cleaning pipeline in order to remove the remaining sequences?
Primer dimers in this dataset:
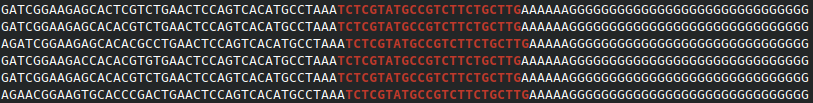
- The set of “AAAA” bases directly adjacent to the Illumina adapter sequence are due to a spacing sequence on the flow cell.
- The “GGGGG” sequences occur because the NovaSeq 6000 uses a 2-channel detection system, where the “G” base is the absence of signal. Once the polymerase reaches the end of the template + spacing sequence it stops, so all subsequent flow cycles produce no signal.
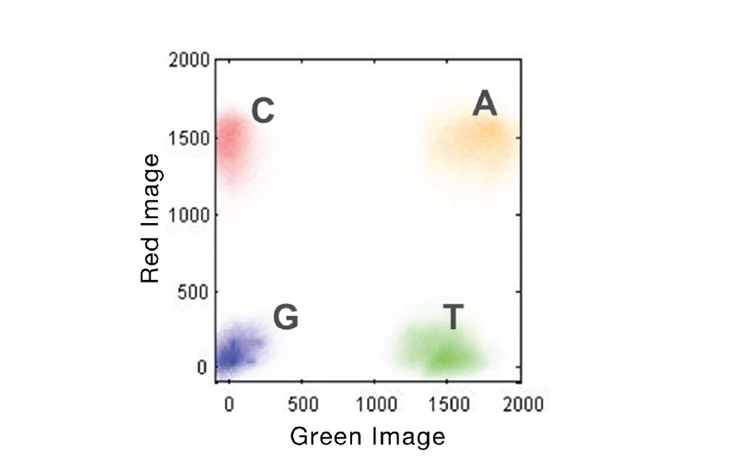
Figure 2. 2-Channel SBS Imaging. Accelerated detection of all 4 DNA bases is performed using only 2 images to capture red and green filter wavelength bands. A bases will be present in both images (yellow cluster), C bases in red only, T bases in green only, and G bases in neither.
From Illumina 2-Channel SBS Technology.
A MultiQC report for HTStream JSON files
Finally lets use MultiQC to generate a summary of our output. Currently MultiQC support for HTStream is in development by Bradley Jenner, and has not been included in the official MultiQC package. If you’d like to try it on your own data, you can find a copy here https://github.com/s4hts/MultiQC.
## Run multiqc to collect statistics and create a report:
cd /share/workshop/mrnaseq_workshop/$USER/rnaseq_example
module load multiqc/htstream.dev0
mkdir -p 02-HTS_multiqc_report
multiqc -i HTSMultiQC-cleaning-report -o 02-HTS_multiqc_report ./01-HTS_Preproc
Transfer HTSMultiQC-cleaning-report_multiqc_report.html to your computer and open it in a web browser.
Or in case of emergency, download this copy: HTSMultiQC-cleaning-report_multiqc_report.html
End Group Exercise 3
Questions
-
Any problematic samples?
-
Anything else worth discussing?