Barcode Table
Requires 3 columns: BarcodeID [a name for the pair], Index1 (Read2 in RC), Index2 (Read3) in a plain tab-delimited text file.
Orientation is important, but you can change in the preprocess arguments.
First line is a comment and just help me remembers.
#BarcodeID Read2RC Read3
P7LeelaR1.P5LeelaF1 TAAGGCGA TAGATCGC
P7LeelaR1.P5LeelaF2 TAAGGCGA CTCTCTAT
P7LeelaR1.P5LeelaF3 TAAGGCGA TATCCTCT
P7LeelaR1.P5LeelaF4 TAAGGCGA AGAGTAGA
P7LeelaR1.P5LeelaF5 TAAGGCGA GTAAGGAG
P7LeelaR1.P5LeelaF6 TAAGGCGA ACTGCATA
P7LeelaR1.P5LeelaF7 TAAGGCGA AAGGAGTA
P7LeelaR1.P5LeelaF8 TAAGGCGA CTAAGCCT
P7LeelaR1.P5LeelaF9 TAAGGCGA TGAACCTT
Barcode table for the workshop.
Primer Table
Requires 4 columns: the read in which the primer should be checked for (allowable are P5/P7, R1/R2, READ1/READ2, F/R, FORWARD/REVERSE, Primer Pair ID describes which should be found ‘together’, Primer ID individual id, and sequence (IUPAC ambiguity characters are allowed).
#Read Pair_ID Primer_ID Sequence
P5 16S_V3V5 319F_1 GTACTCCTACGGGAGGCAGCAGT
P5 16S_V3V5 319F_2 CGTACTCCTACGGGAGGCAGCAGT
P5 16S_V3V5 319F_3 TCGTACTCCTACGGGAGGCAGCAGT
P5 16S_V3V5 319F_4 ATCGTACTCCTACGGGAGGCAGCAGT
P7 16S_V3V5 806R_NV1 CCGGACTACNVGGGTATCTAAT
P7 16S_V3V5 806R_NV2 GCCGGACTACNVGGGTATCTAAT
P7 16S_V3V5 806R_NV3 TGCCGGACTACNVGGGTTTCTAAT
P7 16S_V3V5 806R_NV4 ATGCCGGACTACNVGGGTTTCTAAT
Primer table for the workshop.
Samples Table
Requires 4 columns and a header: SampleID samples name, PrimerPairID same as in primer file, barcodeID same as in barcode file, and ProjectID which represents the file prefix for the output and can include a path. SampleID, PrimerPairID, BarcodeID pairs must be unique. In addition for PrimerPairID, can be comma separated, * (match any primer), or ‘-’ should match no primer.
Additional columns are allowed and will be added to the biom file in dbcAmplicons abundances.
SampleID PrimerPairID BarcodeID ProjectID Treatment Timepoint Replicate
sample1 16S_V3V5 P7LeelaR9.P5LeelaF7 MCA_Workshop/workshop-6SV3V5 ABC_Control T1 4
sample2 16S_V3V5 P7LeelaR10.P5LeelaF9 MCA_Workshop/workshop-6SV3V5 ABC_Condition1 T1 1
sample3 16S_V3V5 P7LeelaR10.P5LeelaF11 MCA_Workshop/workshop-6SV3V5 ABC_Condition1 T1 2
sample4 16S_V3V5 P7LeelaR10.P5LeelaF13 MCA_Workshop/workshop-6SV3V5 ABC_Condition1 T1 3
sample5 16S_V3V5 P7LeelaR10.P5LeelaF15 MCA_Workshop/workshop-6SV3V5 ABC_Condition1 T1 4
sample6 16S_V3V5 P7LeelaR11.P5LeelaF17 MCA_Workshop/workshop-6SV3V5 ABC_Condition2 T1 1
sample7 16S_V3V5 P7LeelaR11.P5LeelaF19 MCA_Workshop/workshop-6SV3V5 ABC_Condition2 T1 2
sample8 16S_V3V5 P7LeelaR11.P5LeelaF21 MCA_Workshop/workshop-6SV3V5 ABC_Condition2 T1 3
sample9 16S_V3V5 P7LeelaR11.P5LeelaF23 MCA_Workshop/workshop-6SV3V5 ABC_Condition2 T1 4
Samples table for the workshop.
Sequence Reads
Typically you receive fastq file(s) from the sequencing provider.
- Fastq files are actually not raw data from the provider, “raw” data is actually bcl files.
- Sequencing provider will run an application bcl2fastq with a sample sheet to produce demultiplexed (by barcode) fastq files.
- For dbcAmplicons you want to request from your sequencing provider non-demultiplexed fastq (so one set of fastqs for the entire run) with the index reads.
fastq
fastq files combine the sequence and quality scores into 1 file. Each sequence here has 4 lines (should be enforced strictly), header, sequence, historical ‘+’, and quality.
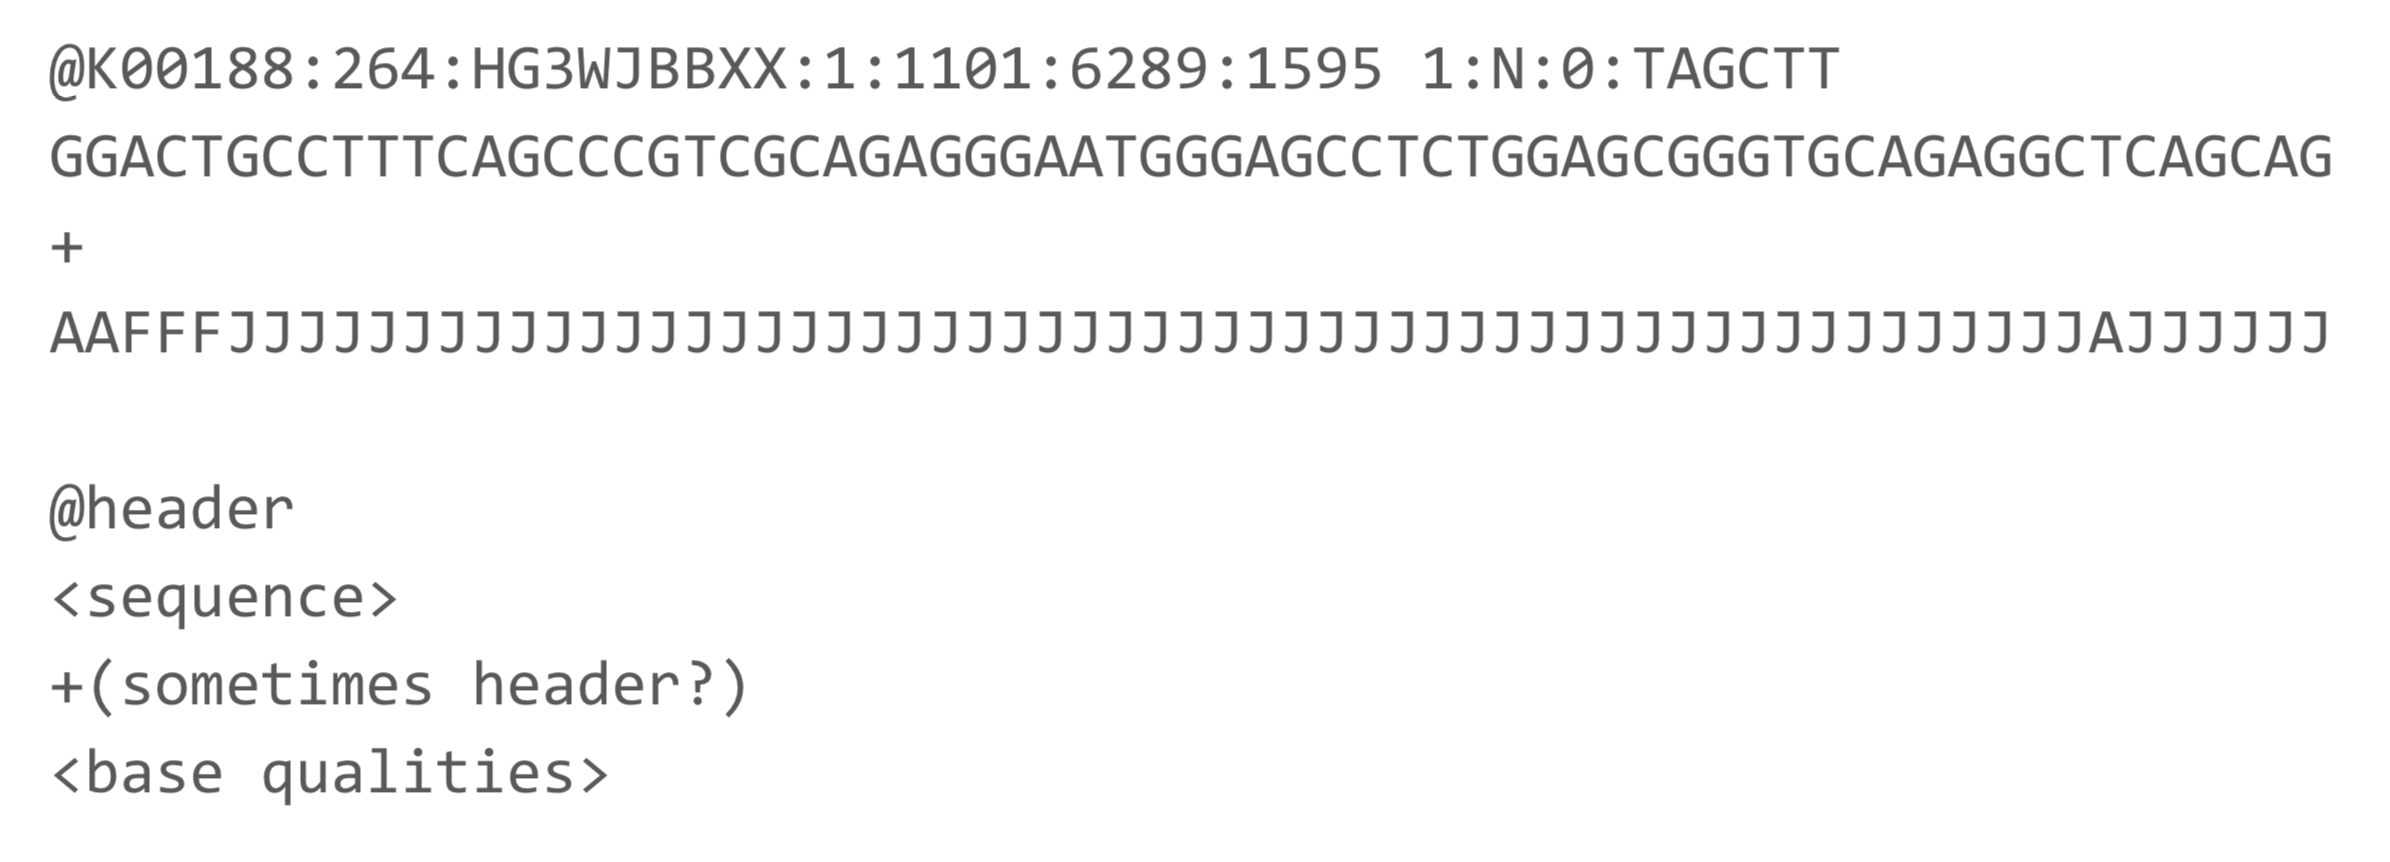
CASAVA 1.8 Read IDs
@EAS139:136:FC706VJ:2:2104:15343:197393 1:Y:18:ATCACG
- EAS139 the unique instrument name
- 136 the run id
- FC706VJ the flowcell id
- 2 flowcell lane
- 2104 tile number within the flowcell lane
- 15343 ’x’-coordinate of the cluster within the tile
- 197393 ’y’-coordinate of the cluster within the tile
- 1 the member of a pair, 1 or 2 (paired-end or mate-pair reads only)
- Y Y if the read fails filter (read is bad), N otherwise
- 18 0 when none of the control bits are on, otherwise it is an even number
- ATCACG index sequence
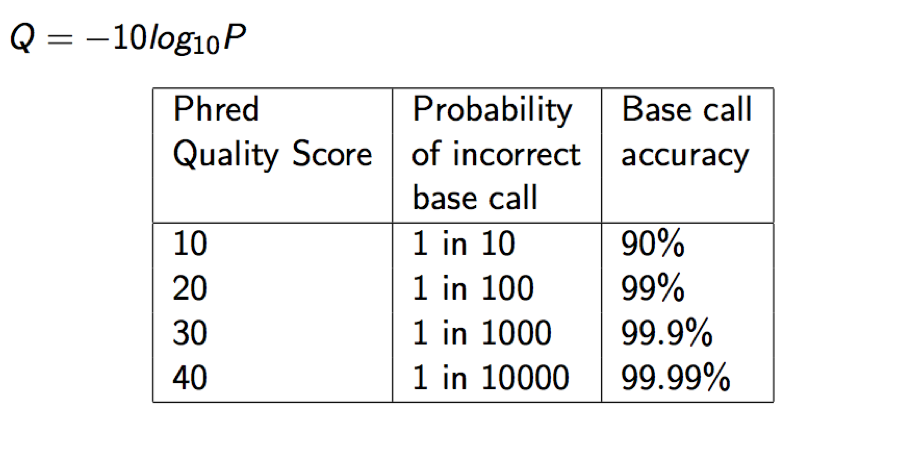
Quality scores
Quality scores are paired 1 to 1 with sequence characters.
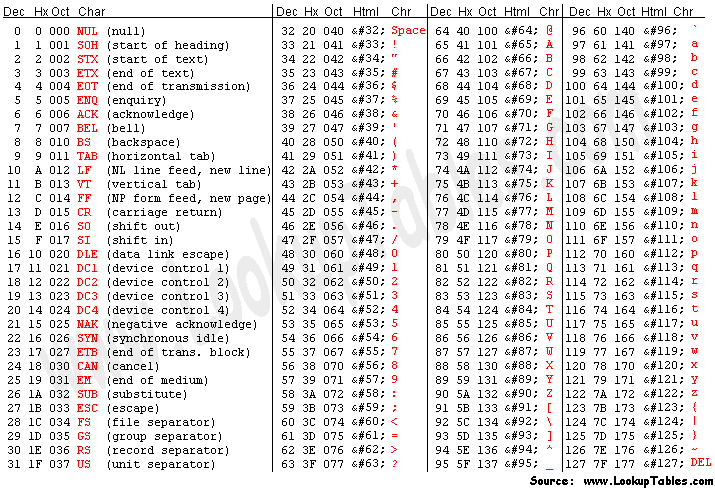
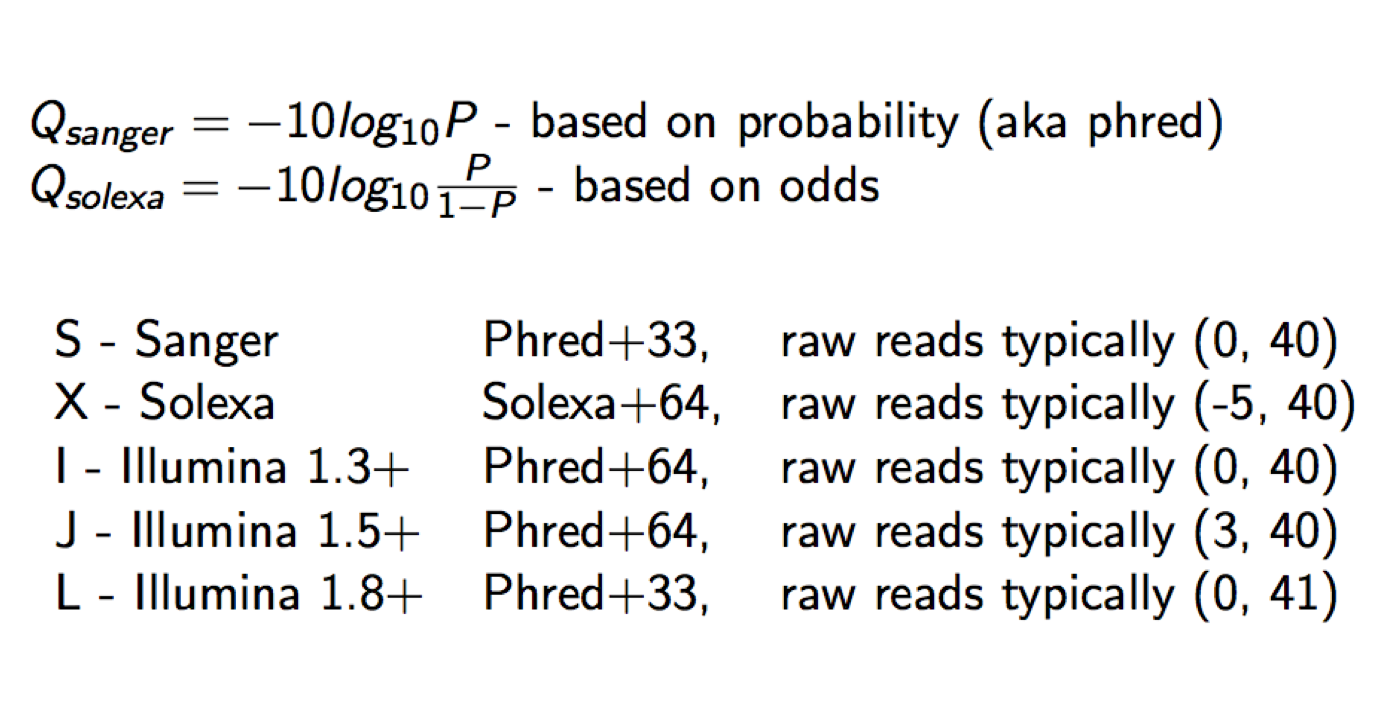
Each quality character has a numerical value associated with it (ASCII value). In Illumina 1.8+ you subtract 33 from the ascii value associated with the quality character to get the quality score.
dbcAmplicons
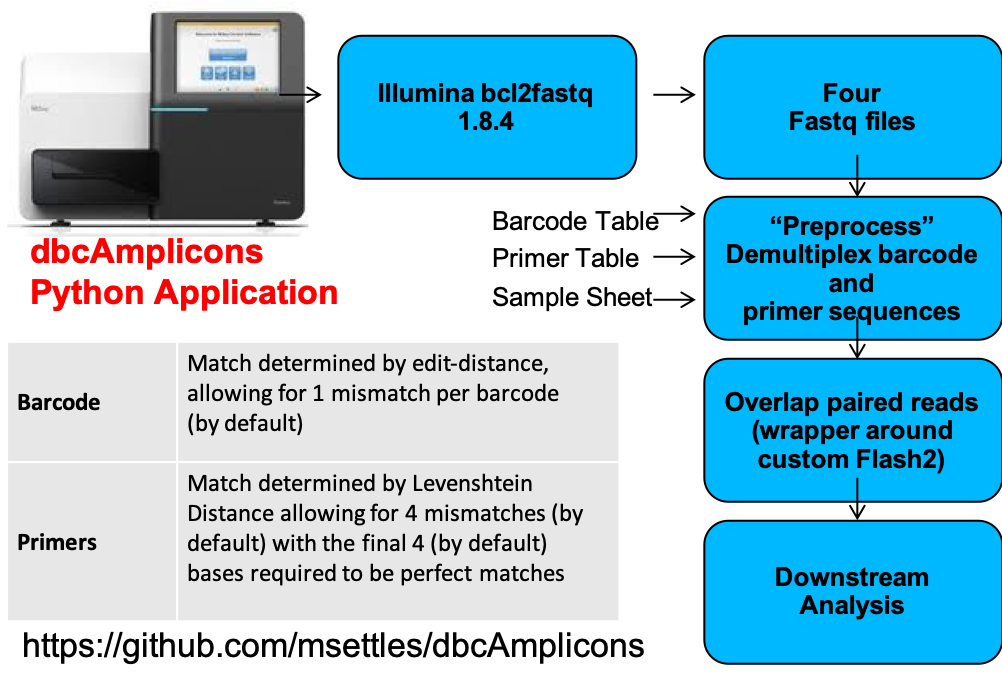
Preprocessing reads
usage: dbcAmplicons [-h] [--version]
{validate,preprocess,join,screen,classify,abundance,extract}
...
dbcAmplicons, a python package for preprocessing of massively multiplexed,
dual barcoded Illumina Amplicons
positional arguments:
{validate,preprocess,join,screen,classify,abundance,extract}
commands
validate validate the sample, barcode and primer sheets
preprocess Preprocess four read raw amplicon data, identifying
barcode and primer sequence
join join reads using flash2
screen screen reads using bowtie2 and a reference sequence
file
classify classify reads using RDP generating a fixrank formated
file
abundance Generate an abundance table from a fixrank formated
file
extract extract reads corresponding to soecific taxa
optional arguments:
-h, --help show this help message and exit
--version show program's version number and exit
For questions or comments, please contact Matt Settles <settles@ucdavis.edu>
dbcAmplicons version: 0.9.1
Application specific downstream
dbcAmplicons Python Application
- Screen - Using Bowtie2, screen targets against a reference fasta file, separating reads by those that produce matches and those that do not match sequences in the reference database.
- Classify - Wrapper around the MSU Ribosomal Database Project (RDP) Classifier for Bacterial and Archaeal 16S rRNA sequences, Fungal 28S rRNA, fungal ITS regions
- Abundance - Reduce RDP classifier results to abundance tables (or biom file format), rows are taxa and columns are samples ready for additional community analysis.
- Extract - Extract the reads associated with as taxonomic group for separate processing.
Targeted Re-sequencing
Set up R functions
- Consensus - Reduce reads to consensus sequence for each sample and amplicon.
- Most Common – Reduce reads to the most commonly occurring read in the sample and amplicon ( that is present in at least 5% and 5 reads, by default )
- Haplotypes – Impute the different haplotypes in the sample and amplicon
Supplemental Scripts
- convert2Readto4Read.py - For when samples are processed by someone else
- splitReadsBySample.py - To facilitate upload to the SRA
- preprocPair_with_inlineBC.py - Cut out inline BC and create 4 reads for standard input processing
Will work with ”Mills lab” protocol
- dbcVersionReport.sh - Print out version numbers of all tools
Validate
Validate the barcode, primer and sample sheet (Must have all 3). Can be performed before data is available to check and be ready for preprocessing once available.
- Read in the metadata input tables: Barcodes, Primers (optional), Samples (optional).
- Validate that there are no duplicate sample/barcode/primer combos.
- Validate that all barcodes listed in the sample sheet are in the barcode table.
- Validate that all primers listed in the sample sheet are in the primer table.
Report any errors.
Preprocessing
Preprocess reads for barcode and primer, match to sample sheet, only “legitimate” (contain matching barcode/primer) will be output.
- Read in the metadata input tables: Barcodes, Primers (optional), Samples (optional)
- Read in a batch of reads (default 100,000), for each read.
- Compare index barcodes to the barcode table, note best matching barcode.
- Compare 5’ end of reads to the primer table, note best matching primer.
- Compare to barcode:primer pair to the sample table, note sampleID and projectID.
- If its a legitimate reads (contains matching barcode,primer,sample) output the read pair to the output file.
- Output Identified_Barcodes.txt file.
Output:
Preprocessed reads
Identified_Barcodes.txt

Barcode Comparison - compares each barcode to all possible barcodes and returns the best match < desired edit distance.
Primer Comparison - compares the beginning (primer region) of each read to all possible primers and returns the best match < specified maximimum Levenshtein distance + final 4 exact match

Join
Uses Flash2 to merge reads that overlap to produce a longer (or sometimes shorter read).
Modification to original Flash algorithm include:
- Performs complete overlaps with adapter trimming
Allows for different sized reads (after cutting primer off)
- Discards reads with > 50% Q of 10 or less, which are indicative of adapter/primer dimers
Output:
prefix.notCombined_1.fastq.gz prefix.notCombined_2.fastq.gz
prefix.extendedFrags.fastq.gz
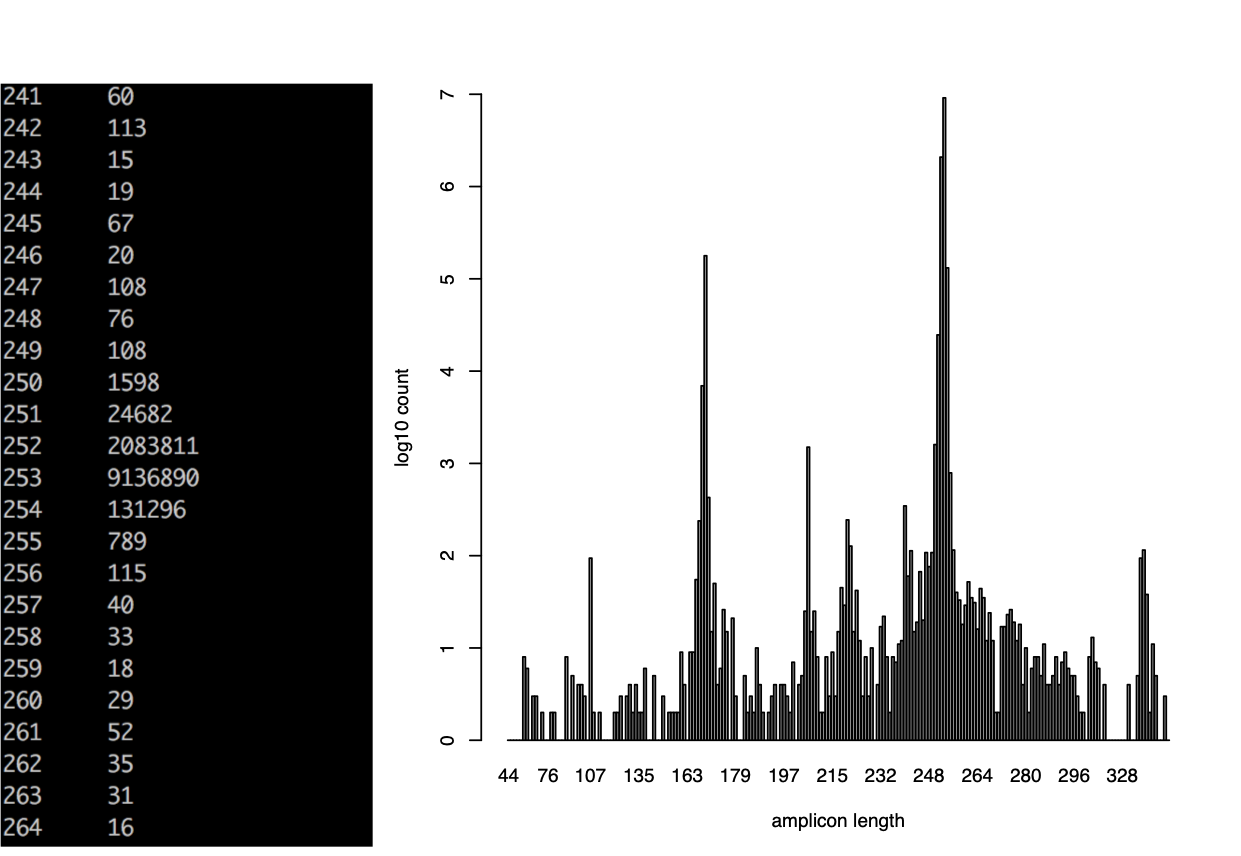
prefix.hist
prefix.histogram
Overlapping and Adapter trimming by overlapping reads.
Consider the three scenarios below
Insert size > length of the number of cycles

Insert size < length of the number of cycles (10bp min)

Insert size < length of the read length

Overlapping produces histograms of the overlapped Reads
Classify
For each read determine which organism is likely came from.
-
Uses the RDP (Ribosomal Database Project) classifier for bacterial and archaeal 16S, fungal LSU, ITS warcup/unite databases. You can provide your own training database
-
Classifies sequences to the closest taxonomic reference provides a bootstrap score for reliability
-
Concatenates Paired-end reads
- Can trim off low quality ends, to some value Q
Output:
fixrank file
M02034:401:000000000-C8N5M:1:1101:11714:1767|sample29:16S_V3V5:428 Bacteria domain 1.0 "Proteobacteria" phylum 1.0 Betaproteobacteria class 0.96 Burkholderiales order 0.46 Burkholderiales_incertae_sedis family 0.31 Thiobacter genus 0.31
M02034:401:000000000-C8N5M:1:1101:10173:1770|sample37:16S_V3V5:424 Bacteria domain 1.0 "Proteobacteria" phylum 1.0 Deltaproteobacteria class 1.0 Myxococcales order 1.0 Nannocystaceae family 0.94 Pseudenhygromyxa genus 0.31
M02034:401:000000000-C8N5M:1:1101:10965:1770|sample37:16S_V3V5:424 Bacteria domain 1.0 "Bacteroidetes" phylum 1.0 Sphingobacteriia
class 0.78 "Sphingobacteriales" order 0.78 "Saprospiraceae" family 0.53 Phaeodactylibacter genus 0.53
M02034:401:000000000-C8N5M:1:1101:17130:1771|sample48:16S_V3V5:403 Bacteria domain 0.99 candidate division WPS-1 phylum 0.68 WPS-1_genera_incertae_sedis class 0.68 WPS-1_genera_incertae_sedis order 0.68 WPS-1_genera_incertae_sedis family 0.68 WPS-1_genera_incertae_sedis genus 0.68
Ribosomal Database Project (RDP) - naïve Bayesian Classifier
- Compares each read to a database
- Database is updates periodically
- Compares by k-mers (15 mers)
- 100 bootstraps to establish confidence in result
Order does not matter, no 3% !
- Drawbacks
- Accepts only fasta (though website implies fastq) files
- Can be slow
- Down to genus only (for 16s, species for ITS)
- Kmer database are based on whole 16s
- Cannot group together unknown OTUs that represent unique taxa
Clustering
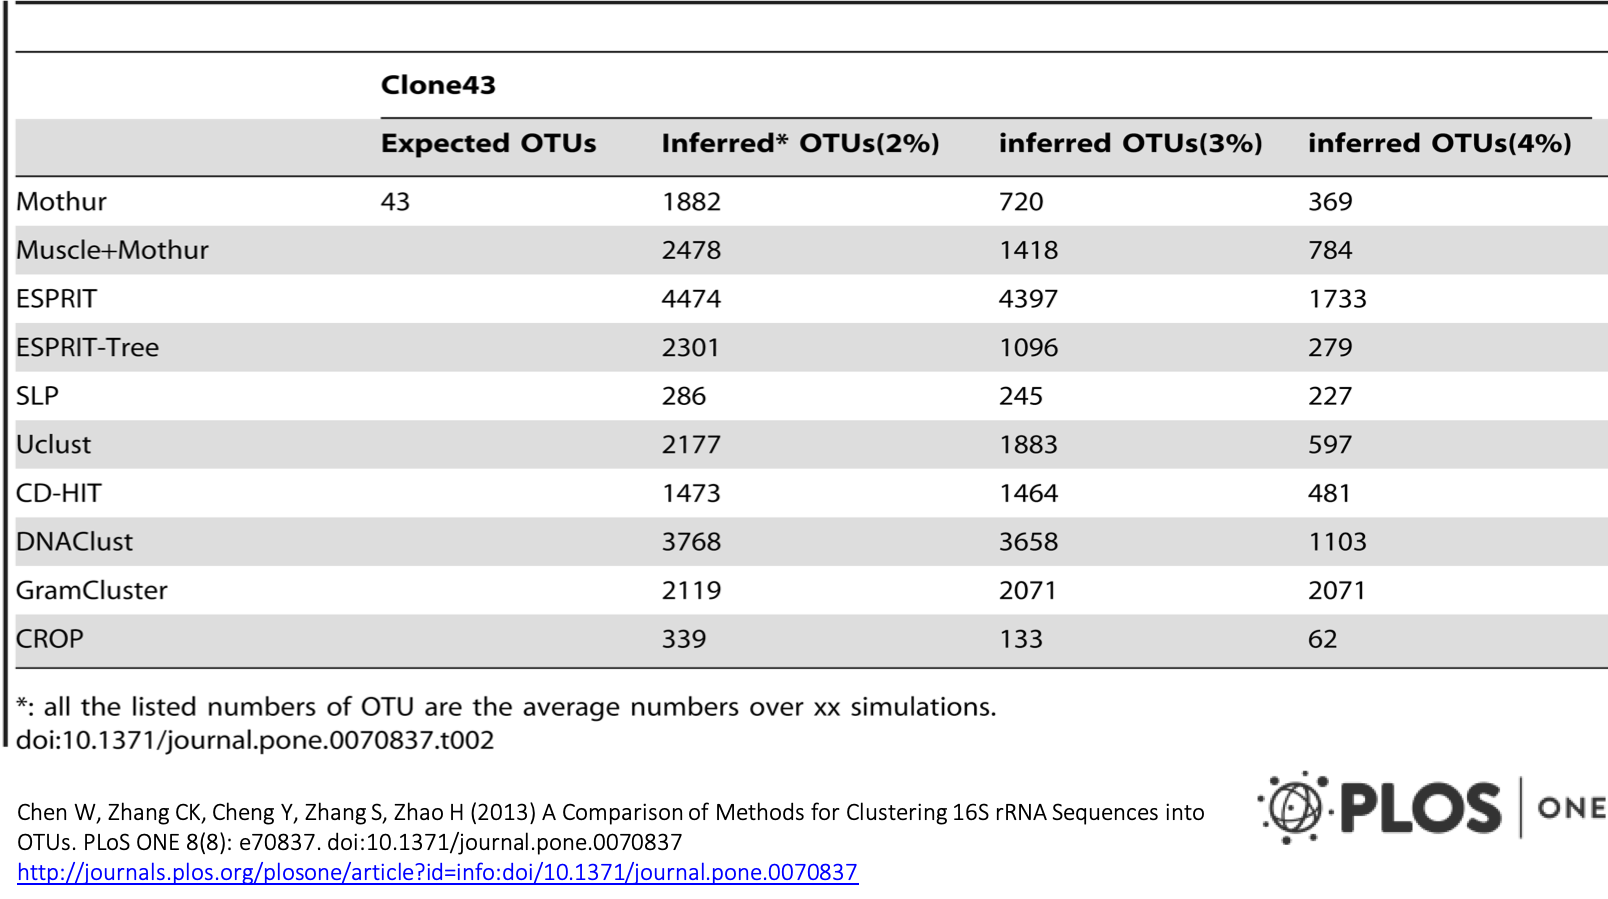
Clustering – “Because of the increasing sizes of today’s amplicon datasets, fast and greedy de novo clustering heuristics are the preferred and only practical approach to produce OTUs”. I DISAGREE
Shared steps in these algorithms are:
- An amplicon is drawn out of the amplicon pool and becomes the center of a new OTU (centroid selection)
- This centroid is then compared to all other amplicons remaining in the pool.
- Amplicons for which the distance is within a global clustering threshold, t (e.g. 3%), to the centroid are moved from the pool to the OUT
- The OTU is then closed. These steps are repeated as long as amplicons remain in the pool.
Why I’m not a fan
- Little to no biological rational to any of the clustering parameters, modify the parameters to get a result you like.
- Dependent on ordering, reorder our reads you can get different set of OTUs. Often not repeatable from run to run.
- 3% (or any other cutoff) is BS.
Most clustering algorithms do not consider sequencing errors.
- If you generate more data you have to start the clustering process all over again as population of sequences matters.
- I’m sure there is more
A Comparison study
Abundance
Takes fixrank file(s) produced from classify and outputs abundance tables and taxa_info table
Abundance tables
- Rows are taxa
- Columns are samples
- Counts of the number of amplicons for each taxa/samples
Proportions tables
- Same as abundance but each cell is the proportion of amplicons (so counts in cell divided by the columns sum)
Biom file (Biological Observation Matrix)
- JSON/hd5 file format for microbiome files
- http://biom-format.org
- Abundance tables are 0 heavy, a biom file removes the 0’s as well as stores extra metadata
The BIOM file format (canonically pronounced biome) is designed to be a general-use format for representing biological sample by observation contingency tables. BIOM is a recognized standard for the Earth Microbiome Project and is a Genomics Standards Consortium supported project. Contains the abundance counts, the sample names, full taxonomic string [domain through genus/species], and any sample metadata in the sample sheet.
Abundance file
Taxon_Name Level sample1 sample10 sample11 sample12 sample13 sample14 sample15 sample16 sample17 sample18 sample19 sample2 sample20 sample21 sample22 sample23 sample24 sample25 sample26 sample27 sample28 sample29 sample3 sample30 sample31 sample32 sample33 sample34 sample35 sample36 sample37 sample38 sample39 sample4 sample40 sample41 sample42 sample43 sample44 sample45 sample46 sample47 sample48 sample5 sample6 sample7 sample8 sample9
Bacteria domain 2144 2303 3235 2895 2584 2465 2907 2651 2751 3022 2904 3034 2547 2908 1946 2790 2146 2291 2046 2283 2292 2349 2483 2126 2336 2576 2478 1909 2666 2672 2605 2403 2552 2795 2073 2519 3647 3352 3559 3270 2337 2835 2258 2214 3315 3078 2848 3107
Acetothermia_genera_incertae_sedis genus 0 0 0 0 0 0 0 0 0 0 0 0 0 0 00 0 0 0 0 0 0 0 0 0 0 0 0 0 0 0 0 0 0 0 00 0 0 0 0 0 0 0 0 1 0 0
Acidobacteria phylum 29 18 40 36 33 42 37 35 42 25 40 19 43 34 24 32 33 23 23 21 26 34 22 27 33 33 26 28 36 28 19 34 28 39 28 30 44 34 41 29 28 21 29 28 27 35 32 35
Acidobacteria_Gp1 class 14 18 16 16 36 21 32 23 19 12 16 37 25 13 14 15 20 15 16 11 20 27 21 14 18 23 12 16 30 28 19 15 31 17 22 14 39 21 28 31 17 28 25 26 33 27 34 24
Gp10 genus 142 138 214 136 88 132 148 140 141 131 109 140 227 227 90 161 105 135 104 93 99 137 163 188 107 200 99 176 319 202 271 203 170 133 89 160 212 222 284 236 178 187 146 195 185 399 310 241
Gp11 genus 3 14 15 16 7 10 7 6 6 4 8 12 3 9 10 3 3 10 313 4 1 5 7 8 12 6 5 2 8 3 0 6 7 8 2 10 8 4 510 8 6 3 12 4 3 2
Gp12 genus 0 0 4 1 0 2 1 0 2 1 0 1 0 1 0 0 1 2 01 0 1 2 0 0 3 0 0 2 0 1 0 0 1 0 1 1 0 0 01 0 1 0 2 0 1 0
Gp13 genus 0 1 0 0 0 0 0 0 0 1 0 1 0 2 1 0 0 0 00 0 0 0 0 0 4 0 1 0 0 0 0 0 2 0 0 0 0 0 00 0 0 0 0 0 0 0
Gp15 genus 13 66 52 31 42 39 51 28 20 36 42 19 28 44 24 33 36 32 28 15 42 36 25 29 27 35 21 19 21 18 18 20 18 31 12 19 20 19 32 12 24 26 20 14 34 24 32 29
Proportions file
Taxon_Name Level sample1 sample10 sample11 sample12 sample13 sample14 sample15 sample16 sample17 sample18 sample19 sample2 sample20 sample21 sample22 sample23 sample24 sample25 sample26 sample27 sample28 sample29 sample3 sample30 sample31 sample32 sample33 sample34 sample35 sample36 sample37 sample38 sample39 sample4 sample40 sample41 sample42 sample43 sample44 sample45 sample46 sample47 sample48 sample5 sample6 sample7 sample8 sample9
Bacteria domain 0.0402274049196 0.0489947877885 0.0496196085649 0.0535337845335 0.0501620950051 0.0449916040009 0.0449283649908 0.045650227304 0.0440519463883 0.0485695917711 0.0463475748919 0.0512378829331 0.0443991214308 0.0471878752475 0.0444373401535 0.0472865326599 0.0442273607848 0.0436206469793 0.0363345764518 0.0410161513447 0.0454590531347 0.0415340547422 0.0412849375655 0.0391182748215 0.0444224698589 0.0418589535262 0.0424169804861 0.0458894230769 0.0456475583864 0.0469992260606 0.0496389031803 0.0432513184183 0.0484140233723 0.0441304176206 0.0425772264213 0.0473977345426 0.0484355078623 0.0427752893585 0.0442959201454 0.0480606710857 0.0442873656882 0.0459272939347 0.0433147899482 0.0356722790623 0.0491438736936 0.0433496704411 0.040628254326 0.0462957444272
Acetothermia_genera_incertae_sedis genus 0.0 0.0 0.0 0.0 0.0 0.0 0.0 0.0 0.0 0.0 0.0 0.0 0.0 0.0 0.0 0.0 0.0 0.0 0.0 0.0 0.0 0.0 0.0 0.0 0.0 0.0 0.0 0.0 0.0 0.0 0.0 0.0 0.0 0.0 0.0 0.0 0.0 0.0 0.0 0.0 0.0 0.0 0.0 0.0 0.0 1.40837135936e-05 0.0 0.0
Acidobacteria phylum 0.000544120682215 0.000382937985321 0.000613534572673 0.000665705092644 0.000640614990391 0.0007665912243560.000571843654854 0.000602700096432 0.000672548799821 0.000401800064288 0.000638396348373 0.000320870064512 0.0007495729177560.000551715185149 0.000548045305079 0.000542354496458 0.000680103870409 0.000437920070067 0.00040845320547 0.0003772839151290.000515678613221 0.000601174057571 0.000365794855594 0.000496798410245 0.00062754345263 0.000536236594085 0.0004450530640190.000673076923077 0.000616396137251 0.000492506859917 0.000362049581737 0.000611962058352 0.00053118834421 0.0006157732691240.000575090371344 0.000564482745644 0.00058436039099 0.00043387823335 0.000510292982849 0.000426226135011 0.000530614565370.000340202177294 0.000556301553808 0.00045113993394 0.000400266844563 0.000492929975776 0.000456497239618 0.000521516271308
Acidobacteria_Gp1 class 0.000262678950035 0.000382937985321 0.000245413829069 0.000295868930064 0.00069885271679 0.000383295612178 0.000494567485279 0.00039606006337 0.000304248266586 0.000192864030858 0.000255358539349 0.000624852230891 0.000435798207998 0.000210949923733 0.000319693094629 0.000254228670215 0.000412184163884 0.000285600045696 0.0002841413603270.000197624907925 0.000396675856324 0.000477402928071 0.000349167816704 0.000257599175683 0.000342296428707 0.0003737406564840.00020540910647 0.000384615384615 0.000513663447709 0.000492506859917 0.000362049581737 0.000269983261038 0.000588101381090.000268413989106 0.000451856720342 0.000263425281301 0.000517955801105 0.000267983614716 0.000348492768775 0.0004556210408740.00032215884326 0.000453602903059 0.000479570305007 0.000418915652944 0.000489215032244 0.000380260267027 0.0004850283170940.000357611157468
Gp10 genus 0.00266431506464 0.00293585788746 0.0032824099638 0.00251488590554 0.00170830664104 0.00240928670512 0.00228737461941 0.00241080038573 0.0022578423994 0.00210543233687 0.00173963004932 0.00236430573851 0.00395704772862 0.003683510206730.00205516989404 0.0027287210603 0.00216396686039 0.00257040041126 0.00184691884212 0.001670828767 0.0019635454888 0.00242237782021 0.00271020733917 0.0034591889306 0.00203476210398 0.00324991875203 0.00169462512838 0.00423076923077 0.00546195466064 0.00355308520369 0.00516397035004 0.00365377346605 0.00322507208985 0.0020999447383 0.0018279658232 0.00301057464344 0.00281555461113 0.00283296964128 0.003534712369 0.00346859889181 0.00337319259414 0.00302941938828 0.00280069058124 0.00314186739708 0.00274256912015 0.00561940172385 0.0044223170088 0.00359101203958
Gp11 genus 5.6288346436e-05 0.000297840655249 0.000230075464752 0.000295868930064 0.000135888028265 0.000182521720085 0.000108186637405 0.000103320016531 9.60783999744e-05 6.42880102861e-05 0.000127679269675 0.000202654777586 5.22957849597e-050.000146042254892 0.000228352210449 5.08457340429e-05 6.18276245827e-05 0.000190400030464 5.32765050613e-05 0.0002335567093667.93351712648e-05 1.76815899286e-05 8.31351944532e-05 0.000128799587841 0.000152131746092 0.000194995125122 0.0001027045532350.000120192307692 3.42442298473e-05 0.000140716245691 5.71657234322e-05 0.0 0.000113826073759 0.000110523407279 0.00016431153467 3.76321830429e-05 0.000132809179771 0.000102088996082 4.97846812536e-05 7.3487264657e-05 0.000189505201918 0.000129600829445 0.000115096873202 4.83364214936e-05 0.000177896375361 5.63348543744e-05 4.27966162142e-05 2.9800929789e-05
Gp12 genus 0.0 0.0 6.13534572673e-05 1.8491808129e-05 0.0 3.65043440169e-05 1.5455233915e-05 0.0 3.20261333248e-051.60720025715e-05 0.0 1.68878981322e-05 0.0 1.62269172103e-05 0.0 0.0 2.06092081942e-05 3.80800060928e-05 0.0 1.79659007204e-05 0.0 1.76815899286e-05 3.32540777813e-05 0.0 0.0 4.87487812805e-05 0.0 0.0 3.42442298473e-05 0.0 1.90552411441e-05 0.0 0.0 1.57890581827e-05 0.0 1.88160915215e-05 1.32809179771e-05 0.0 0.0 0.0 1.89505201918e-05 0.0 1.91828122003e-05 0.0 2.96493958936e-05 0.0 1.42655387381e-05 0.0
Gp13 genus 0.0 2.12743325178e-05 0.0 0.0 0.0 0.0 0.0 0.0 0.0 1.60720025715e-05 0.0 1.68878981322e-05 0.0 3.24538344205e-05 2.28352210449e-05 0.0 0.0 0.0 0.0 0.0 0.0 0.0 0.0 0.0 0.0 6.49983750406e-05 0.0 2.40384615385e-05 0.0 0.0 0.0 0.0 0.0 3.15781163654e-05 0.0 0.0 0.0 0.0 0.0 0.0 0.0 0.0 0.0 0.0 0.0 0.0 0.0 0.0
Gp15 genus 0.000243916167889 0.00140410594618 0.000797594944475 0.000573246051999 0.000815328169588 0.00071183470833 0.000788216929663 0.000482160077146 0.000320261333248 0.000578592092575 0.000670316165792 0.000320870064512 0.0004880939929580.000713984357252 0.000548045305079 0.000559303074472 0.000741931494992 0.000609280097485 0.000497247380572 0.0002694885108060.00083301929828 0.000636537237428 0.000415675972266 0.000533598292485 0.000513444643061 0.000568735781605 0.0003594659363230.000456730769231 0.000359564413396 0.000316611552804 0.000342994340593 0.000359977681384 0.000341478221278 0.0004894608036630.000246467302005 0.000357505738908 0.000265618359541 0.000242461365696 0.000398277450029 0.000176369435177 0.0004548124846030.000421202695697 0.000383656244005 0.00022556996697 0.00050403973019 0.000338009126246 0.000456497239618 0.000432113481941
Taxa Info file
Supplies extra information about the tax identified in the experiment as well as the full taxonomic path.
Taxon_Name MeanBootstrapValue MeanLengthMerged PercentageAsPairs Total
d__Bacteria 0.997 421 0.0 126506
d__Bacteria;p__Acetothermia;c__Acetothermia_genera_incertae_sedis;o__Acetothermia_genera_incertae_sedis;f__Acetothermia_genera_incertae_sedis;g__Acetothermia_genera_incertae_sedis 0.56 421 0.0 1
d__Bacteria;p__Acidobacteria 0.605 424 0.0 1483
d__Bacteria;p__Acidobacteria;c__Acidobacteria_Gp1 0.983 403 0.0 1049
d__Bacteria;p__Acidobacteria;c__Acidobacteria_Gp10;o__Gp10;f__Gp10;g__Gp10 0.98 427 0.0 8312
d__Bacteria;p__Acidobacteria;c__Acidobacteria_Gp11;o__Gp11;f__Gp11;g__Gp11 0.792 406 0.0 321
d__Bacteria;p__Acidobacteria;c__Acidobacteria_Gp12;o__Gp12;f__Gp12;g__Gp12 0.999 403 0.0 34
d__Bacteria;p__Acidobacteria;c__Acidobacteria_Gp13;o__Gp13;f__Gp13;g__Gp13 0.998 423 0.0 13
d__Bacteria;p__Acidobacteria;c__Acidobacteria_Gp15;o__Gp15;f__Gp15;g__Gp15 0.961 414 0.0 1356
Future Directions
- dbcAmplicons is a data reduction pipeline, produces abundance/biome files, post processing most typically done in R.
- Update to python 3
- Change to allow for bcl2fastq demultiplexed files.
- Replace primer algorithm and FLASH2 with htstream.
- Include screening of diversity sample in preprocessing to get an idea of actual proportion in the pool. Available in htstream.
- Replace RDP classification with another scheme
- Dada2 implementation of RDP classifier
- Use amplicon length in classification
- Add in ability to generate a phylo tree.
- Output data for rarefaction curves
Post Processing
Pretty much do all of my post analysis (abundance table, Biome) in R
Ecological Diversity Analysis
- how does the structure of taxa across samples/groups compare.
Ordination Analysis (multivariate analysis)
- Visualize the relative similarity/dissimilarity across samples, test for taxa/environment relationships
Differential Abundance Analysis (univariate analysis)
- Uses tools from RNAseq (limma, edgeR)
Visualization
- temporal
- heatmaps
- ’trees’
- more
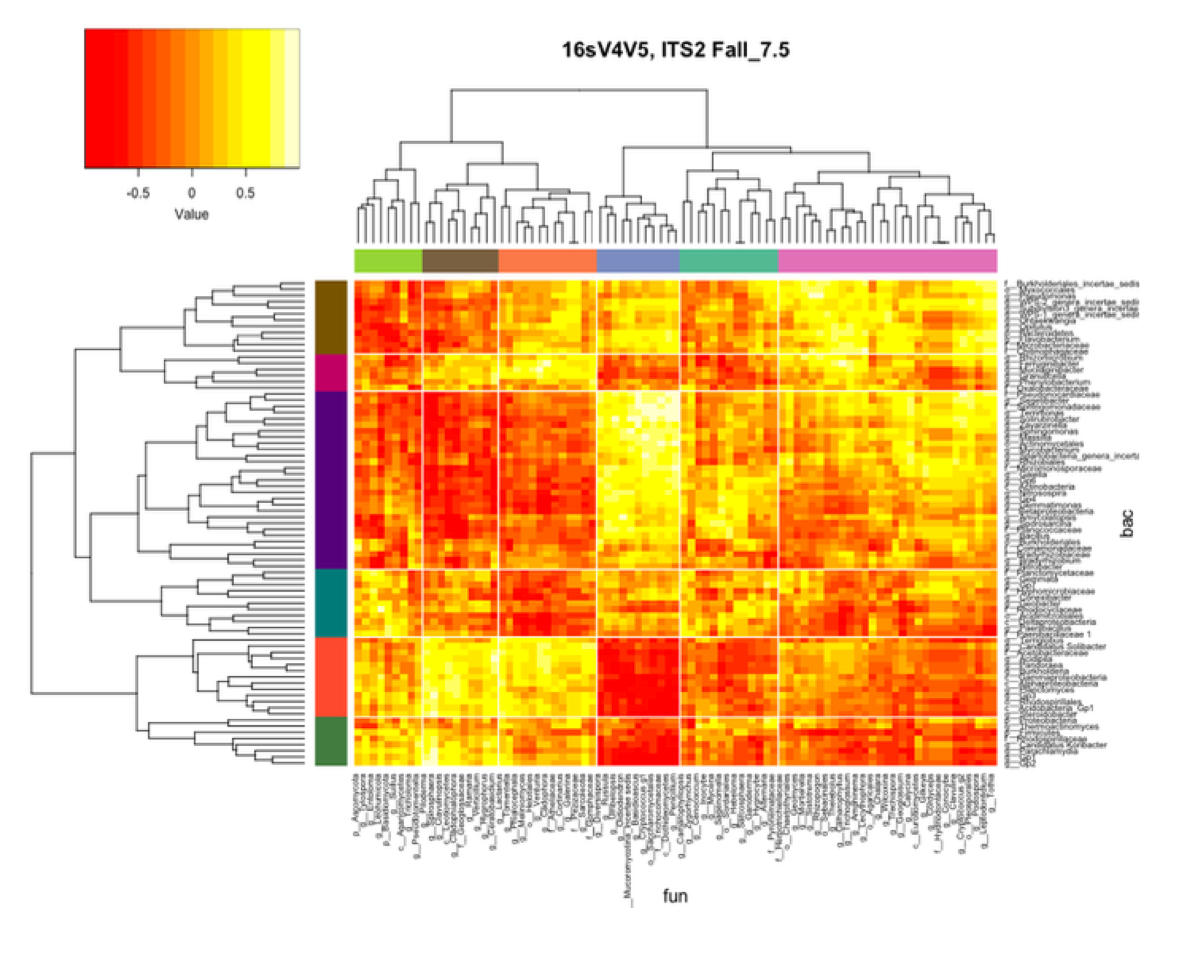
Because dbcAmplicons is suitable for multiple amplicons across multiple communities, cross community analysis is possible.
