
In this section, we will learn how to take two separate datasets and “integrate” them, so that cells of the same type (across datasets) roughly fall into the same region of the tsne or umap plot (instead of separating by dataset first).
Integration is typically done in a few different scenarios, e.g.,
- if you collect data from across multiple conditions/days/batches/experiments/etc. and you want to remove these technical confounders.
- if you are doing a case/control study and you want to identify which cells match across condition.
- you have performed an experiment sequencing cells from a tissue (e.g. lung epithelium) and you want to label the cells by cell type, but you don’t have marker genes available, however, you do have access to a database of annotated cells that you could map onto your dataset (example a cell atlas).
We start with loading needed libraries for R
library(Seurat)
library(tximport)
library(ggplot2)
library(ggVennDiagram)
library(cowplot)
Lets read the data back in and create a list of each dataset rather than merge like we did in Mapping_Comparisons
## Cellranger
cellranger_orig <- Read10X_h5("Adv_comparison_outputs/654/outs/filtered_feature_bc_matrix.h5")
# If hdf5 isn't working read in from the mtx files
#cellranger_orig <- Read10X("Adv_comparison_outputs/654/outs/filtered_feature_bc_matrix")
s_cellranger_orig <- CreateSeuratObject(counts = cellranger_orig, min.cells = 3, min.features = 200, project = "cellranger")
s_cellranger_orig
cellranger_htstream <- Read10X_h5("Adv_comparison_outputs/654_htstream/outs/filtered_feature_bc_matrix.h5")
s_cellranger_hts <- CreateSeuratObject(counts = cellranger_htstream, min.cells = 3, min.features = 200, project = "cellranger_hts")
s_cellranger_hts
## STAR
star <- Read10X("Adv_comparison_outputs/654_htstream_star/outs/filtered_feature_bc_matrix")
s_star_hts <- CreateSeuratObject(counts = star, min.cells = 3, min.features = 200, project = "star")
s_star_hts
## SALMON
txi <- tximport("Adv_comparison_outputs/654_htstream_salmon_decoys/alevin/quants_mat.gz", type="alevin")
## salmon is in ensembl IDs, need to convert to gene symbol
head(rownames(txi$counts))
ens2symbol <- read.table("ens2sym.txt",sep="\t",header=T,as.is=T)
map <- ens2symbol$Gene.name[match(rownames(txi$counts),ens2symbol$Gene.stable.ID.version)]

txi_counts <- txi$counts[-which(duplicated(map)),]
map <- map[-which(duplicated(map))]
rownames(txi_counts) <- map
dim(txi_counts)
s_salmon_hts <- CreateSeuratObject(counts = txi_counts , min.cells = 3, min.features = 200, project = "salmon")
s_salmon_hts
# Need to Check Col names before merge

# they however have different looking cell ids, need to fix
head(colnames(s_cellranger_orig))
head(colnames(s_star_hts))
head(colnames(s_salmon_hts))
s_cellranger_orig <- RenameCells(s_cellranger_orig, new.names = sapply(X = strsplit(colnames(s_cellranger_orig), split = "-"), FUN = "[", 1))

s_cellranger_hts <- RenameCells(s_cellranger_hts, new.names = sapply(X = strsplit(colnames(s_cellranger_hts), split = "-"), FUN = "[", 1))
Instead of merging the datasets (column binding the cells). This time we are going to make an R list
s_list = list(s_cellranger_orig, s_cellranger_hts, s_star_hts, s_salmon_hts)
using the Standare Seurat technique
Normalization and Variable Features
Before we identify integration sites and find anchors, First perform normalization and identify variable features for each
s_standard = s_list
for (i in 1:length(s_standard)) {
    s_standard[[i]] <- NormalizeData(s_standard[[i]], verbose = FALSE)
    s_standard[[i]] <- FindVariableFeatures(s_standard[[i]], selection.method = "vst", nfeatures = 2000, verbose = FALSE)
}
Identify “anchors”
Next, we identify anchors using the FindIntegrationAnchors function, which takes a list of Seurat objects as input.
- Representation of two datasets, reference and query, each of which originates from a separate single-cell experiment. The two datasets share cells from similar biological states.
- Seurat perform canonical correlation analysis, followed by L2 normalization of the canonical correlation vectors, to project the datasets into a subspace defined by shared correlation structure across datasets.
- In the shared space, Seurat identify pairs of MNNs across reference and query cells. These should represent cells in a shared biological state across datasets and serve as anchors to guide dataset integration. In principle, cells in unique populations should not participate in anchors, but in practice, there will be ‘incorrect’ anchors hopefully at low frequency.
- For each anchor pair, Seurat assigns a score based on the consistency of anchors across the neighborhood structure of each dataset.
- The utilizes anchors and their scores to compute ‘correction’ vectors for each query cell, transforming its expression so it can be jointly analyzed as part of an integrated reference.
?FindIntegrationAnchors
We use all default parameters here for identifying anchors, including the ‘dimensionality’ of the dataset (30)
s.anchors_standard <- FindIntegrationAnchors(object.list = s_standard, dims = 1:30)
s.integrated_standard <- IntegrateData(anchorset = s.anchors_standard, dims = 1:30)
The returned object
will contain a new Assay, which holds an integrated (or ‘batch-corrected’) expression matrix for all cells, enabling them to be jointly analyzed.
s.integrated_standard
DefaultAssay(object = s.integrated_standard) <- "RNA"
s.integrated_standard
DefaultAssay(object = s.integrated_standard) <- "integrated"
s.integrated_standard
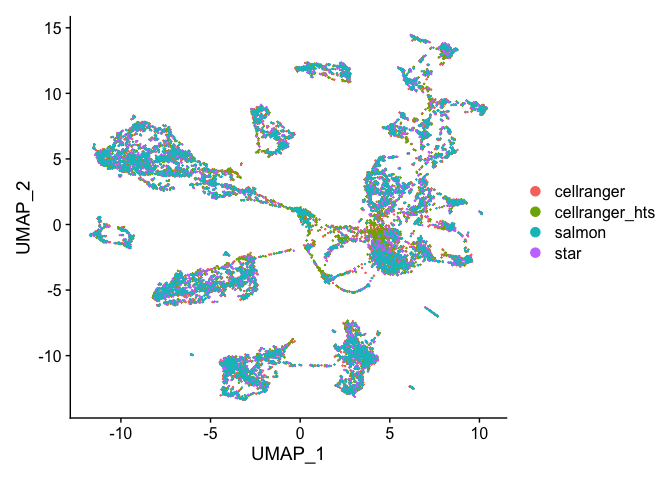
Now visualize after anchoring and integration
Run the standard workflow for visualization and clustering
s.integrated_standard <- ScaleData(s.integrated_standard, verbose = FALSE)
s.integrated_standard <- RunPCA(s.integrated_standard, npcs = 30, verbose = FALSE)
s.integrated_standard <- RunUMAP(s.integrated_standard, reduction = "pca", dims = 1:30)
DimPlot(s.integrated_standard, reduction = "umap")
Excersise
Check the help of FindIntegrationAnchors. What happens when you change dims (try varying this parameter over a broad range, for example between 10 and 50), k.anchor, k.filter and k.score?
| dims | Which dimensions to use from the CCA to specify the neighbor search space |
| k.anchor | How many neighbors (k) to use when picking anchors |
| k.filter | How many neighbors (k) to use when filtering anchors |
| k.score | How many neighbors (k) to use when scoring anchors |
Example
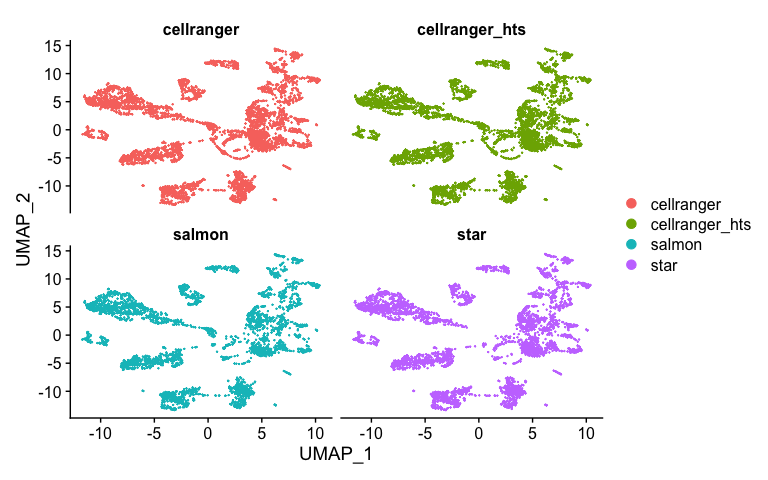
Now lets look closer
Splitting by prepocessing type
DimPlot(s.integrated_standard, reduction = "umap", split.by = "orig.ident", ncol=2)
We can conduct more analysis, perform clustering
s.integrated_standard <- FindNeighbors(s.integrated_standard, reduction = "pca", dims = 1:30)
s.integrated_standard <- FindClusters(s.integrated_standard, resolution = 0.5)
p1 <- DimPlot(s.integrated_standard, reduction = "umap", group.by = "orig.ident")
p2 <- DimPlot(s.integrated_standard, reduction = "umap", label = TRUE, label.size = 6)
plot_grid(p1, p2)
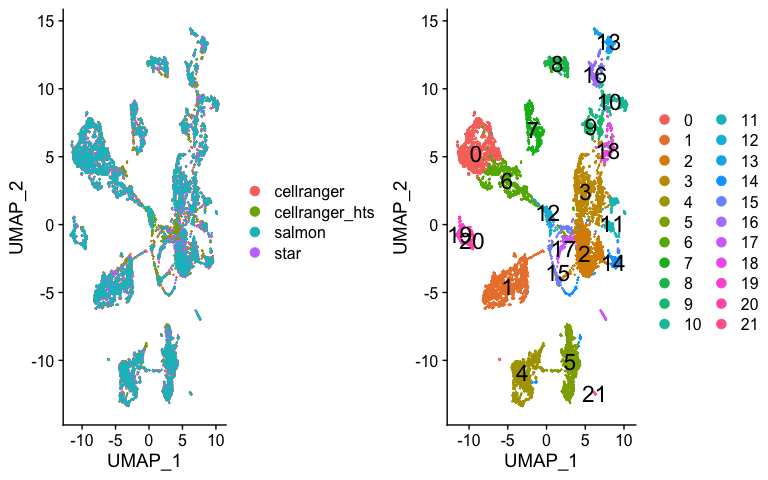
Now lets look at cluster representation per dataset
t <- table(s.integrated_standard$integrated_snn_res.0.5, s.integrated_standard$orig.ident)
t
round(sweep(t,MARGIN=2, STATS=colSums(t), FUN = "/")*100,1)
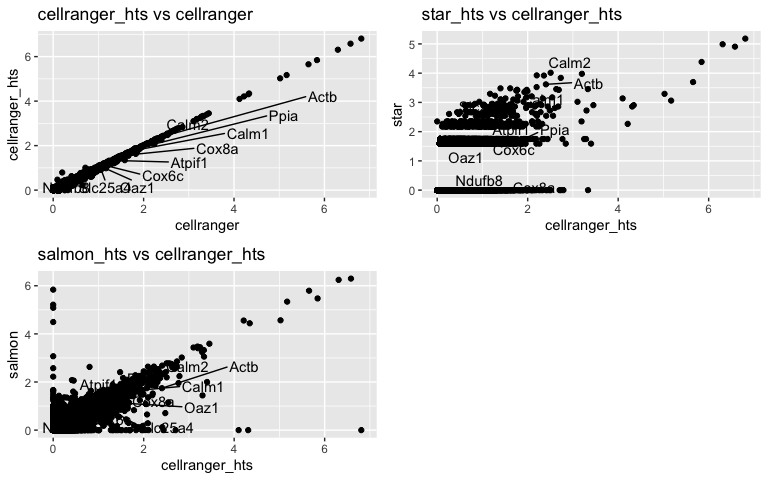
Lets Zero in on cluster 12 some more
markers = FindMarkers(s.integrated_standard, ident.1="12")
top10 <- rownames(markers)[1:10]
head(markers)
cluster12 <- subset(s.integrated_standard, idents = "12")
Idents(cluster12) <- "orig.ident"
avg.cell.exp <- log1p(AverageExpression(cluster12, verbose = FALSE)$RNA)
avg.cell.exp$gene <- rownames(avg.cell.exp)

head(avg.cell.exp)
p1 <- ggplot(avg.cell.exp, aes(cellranger, cellranger_hts)) + geom_point() + ggtitle("cellranger_hts vs cellranger")
p1 <- LabelPoints(plot = p1, points = top10, repel = TRUE)
p2 <- ggplot(avg.cell.exp, aes(cellranger_hts, star)) + geom_point() + ggtitle("star_hts vs cellranger_hts")
p2 <- LabelPoints(plot = p2, points = top10, repel = TRUE)
p3 <- ggplot(avg.cell.exp, aes(cellranger_hts, salmon)) + geom_point() + ggtitle("salmon_hts vs cellranger_hts")
p3 <- LabelPoints(plot = p3, points = top10, repel = TRUE)
plot_grid(p1,p2,p3, ncol = 2)
Possible continued analysis
We know the majority of ‘cells’ are in common between the datasets, so how is the cell barcode representation in each cluster. So for this cluster 12, what is the overlap in cells for cellranger/salmon/star if those cells are present in star, where did they go? Which cluster can they be found in.
How I would go about doing this Get the superset of cell barcode from all 4 methods for cluster 12. Then extract these cells from the whole dataset (subset) and table the occurace of this subset of cells [superset of those found in 12], sample by cluster like we did above.
ALSO
Salmon had a few ‘unique’ cells, where did these go?
More reading
For a larger list of alignment methods, as well as an evaluation of them, see Gerald Quons paper, “scAlign: a tool for alignment, integration, and rare cell identification from scRNA-seq data”
Using SCTransform (Not Evaluated because it takes a really long time)
s_sct <- s_list
for (i in 1:length(s_sct)) {
    s_sct[[i]] <- SCTransform(s_sct[[i]], verbose = FALSE)
}
s_features_sct <- SelectIntegrationFeatures(object.list = s_sct, nfeatures = 2000)

s_sct <- PrepSCTIntegration(object.list = s_sct, anchor.features = s_features_sct,
    verbose = FALSE)
Identify anchors and integrate the datasets.
Commands are identical to the standard workflow, but make sure to set normalization.method = ‘SCT’:
s_anchors_sct <- FindIntegrationAnchors(object.list = s_sct, normalization.method = "SCT",  anchor.features = s_features, verbose = FALSE)
s_integrated_sct <- IntegrateData(anchorset = s_anchors_sct, normalization.method = "SCT", verbose = FALSE)
Now visualize after anchoring and integration
However, do not sun ScaleData, SCTransform does this step
s.integrated_sct <- RunPCA(s.integrated_sct, npcs = 30, verbose = FALSE)
s.integrated_sct <- RunUMAP(s.integrated_sct, reduction = "pca", dims = 1:30)
DimPlot(s.integrated_sct, reduction = "umap")
Rest is the same
More reading on SCTransform
Finally, save the original object, write out a tab-delimited table that could be read into excel, and view the object.
## anchored dataset in Seurat class
save(s.integrated_standard,file="anchored_object.RData")
Also we will save a RDS file for usage in the shiny app as well:
saveRDS(s.integrated_standard, file = "anchoring.rds")
Session Information
sessionInfo()